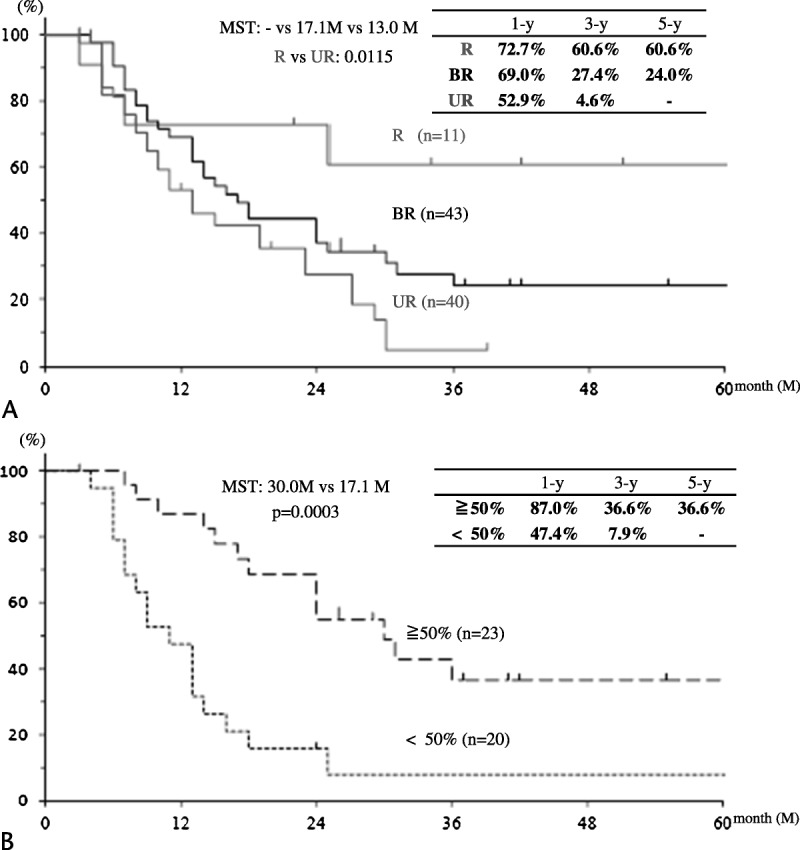
FIGURE 2.

Survival curves after initial treatment in reassessed patients. A, Cumulative survival curves according to the 3 groups in 94 patients who were reassessed. B, Cumulative survival curves according to the CA19-9 reduction rate in 43 BR patients who were reassessed.
