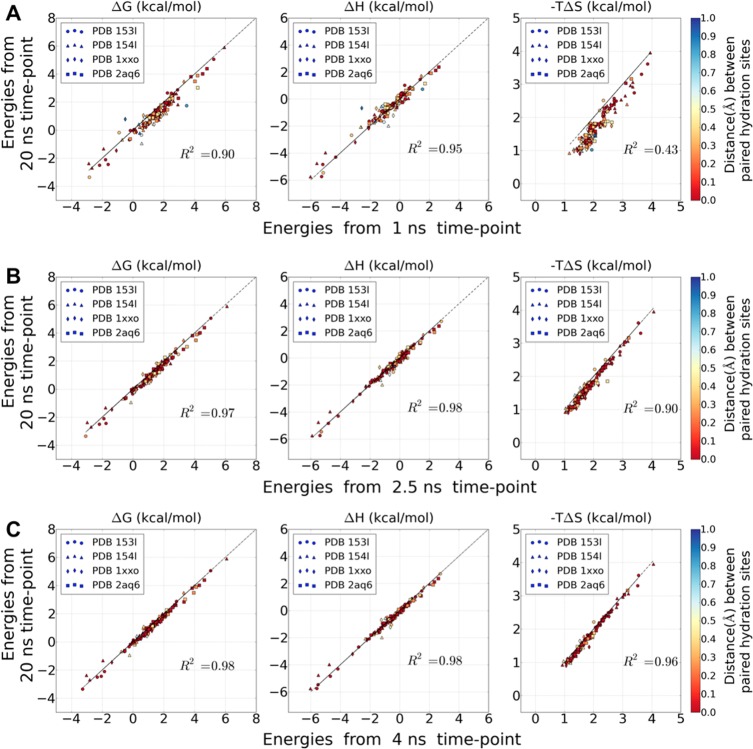
Figure 1.
Correlation of energy values of the paired hydration sites between those obtained from the 20 ns MD simulations and those obtained from shorter simulation lengths: (A) 1, (B) 2.5, (C) 4 ns. The correlation coefficients (R2) is calculated to the regression line with the slope =1 and zero point = 0, i.e. y = x. (left) Desolvation free energy ΔG (kcal/mol), (middle) enthalpy ΔH (kcal/mol), and (right) entropy −TΔS (kcal/mol). The distances between paired hydration sites are color coded according to the color bar.

