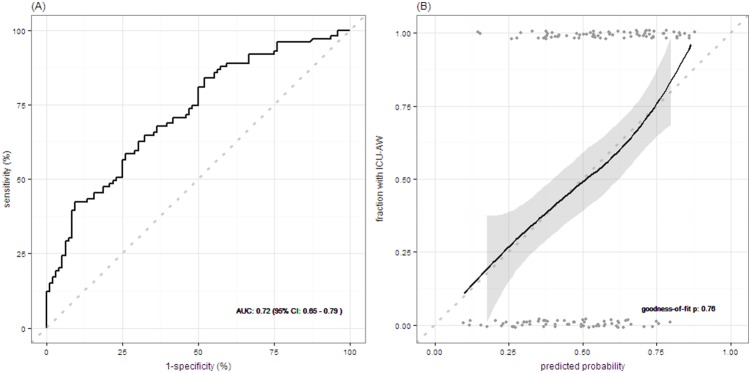
Figure 2. Model performance for early prediction of Intensive Care Unit – acquired weakness.

Panel A shows the receiver operating characteristic (ROC) curve assessing discrimination of the prediction model. Panel B shows model calibration assessed with a fitted curve based on loess regression with 95% confidence interval (perfect model calibration is illustrated by the dotted line). Goodness-of-fit assessed with the Hosmer–Lemeshow test is shown. Grey points represent predicted probabilities for individual patients. AUC: area under the receiver operating characteristic curve; CI: confidence interval; ICU-AW: Intensive Care Unit – acquired weakness.
