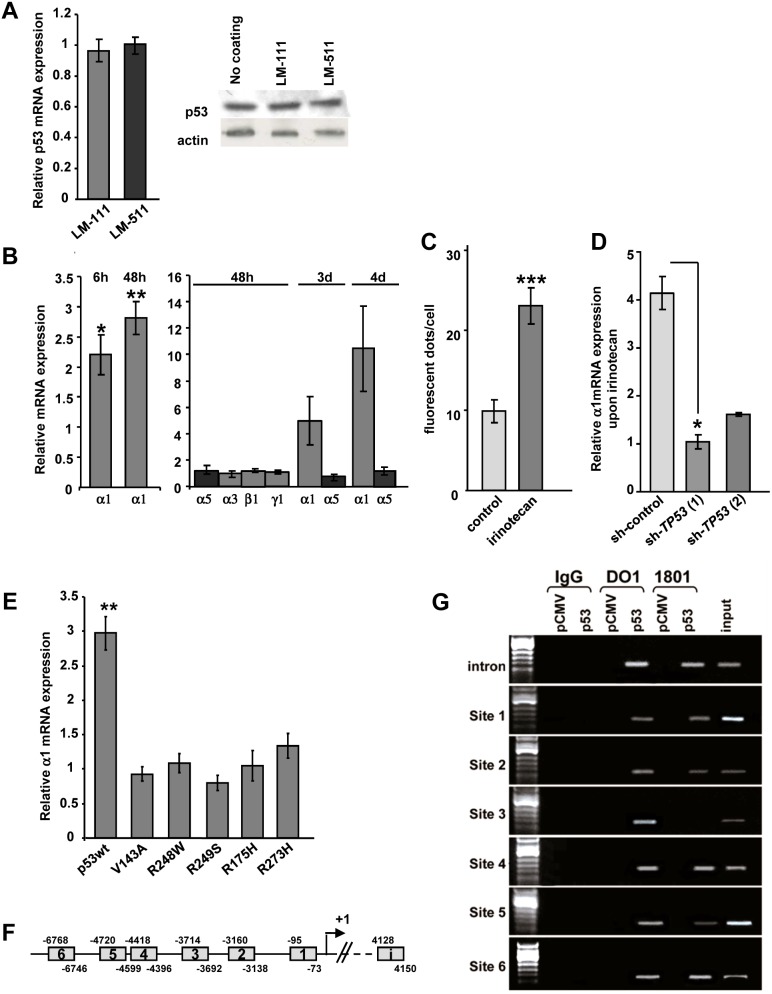
Figure 2. Wild-type p53 induces LMα1 expression in epithelial cells via binding to the LAMA1 promoter.
(A) HCT116 cells were seeded on LM-111 or LM-511-enriched matrix. (Left) Endogenous p53 mRNA was quantified by RT-qPCR (normalized to GAPDH) and expressed as ratio relative to the control (plastic dishes). The values are given as a mean +/− SEM of 9 independent experiments which were pooled (n = 3 at 2 days; n = 3 at 3 days; n = 3 at 4 days). (Right) Representative immunoblot of p53 and actin from HCT116 cells in the different conditions. Data show that LM substrata do not activate endogenous expression of p53. (B) Relative mRNA expression of LM chains in HCT116 cells upon transfection with a TP53 vector assessed at different time points. Transcript levels were determined by RT-qPCR and normalized to GAPDH and are presented relative to the control vector (n = 3 to 4 experiments, except for α1 at 6 h n = 6 and at 48 h n = 8). Data show that wild-type (wt) p53 induces selectively and progressively LMα1 mRNA levels. (C) Semiquantitative analysis of intracellular LMα1 after immunofluorescence staining of HCT116 cells (48 h of irinotecan treatment). Note a 2.3-fold intracellular deposition of LMα1 in irinotecan-treated cells as compared to untreated cells (n = 15). (D) Expression of LMα1 mRNA from two independent stable sh-TP53 HCT116 cell lines and in a sh-RNA control cell line, upon treatment with irinotecan. After 48 h, relative mRNA expression of LMα1 was assessed by RT-qPCR and normalized to GAPDH; values are given as ratios relative to those found in the corresponding untreated cells (n = 3). In p53-deprived cells, irinotecan was unable to stimulate LMα1 expression. (E) Relative LAMA1 mRNA expression in HCT116 cells following transfection with wt or mutants p53 (ratios calculated as stated above; n = 6). LMα1 mRNA were only activated by wt p53. (F) Diagram showing the location of putative p53 binding motifs (sites 1 to 6) in the LAMA1 promoter 7 kb upstream of the transcription site and in the 5 kb region of intron 1 (i). (G) Chromatin immunoprecipitation experiments. Chromatin was prepared from HCT116 cells transfected with either the control (pCMV) or TP53 vector (p53). Cross-linked p53-DNA complexes were immunoprecipitated by either IgG (negative control) or anti-p53 antibodies (DO1 or 1801) followed by PCR amplification using primers that flank the putative p53 binding sites. Input represents chromatin before immunoprecipitation. Note that p53 binds to 7 candidate p53 binding sites. Bars represent mean +/−SEM; *p<0.05, **p<0.01, ***p<0.001.

