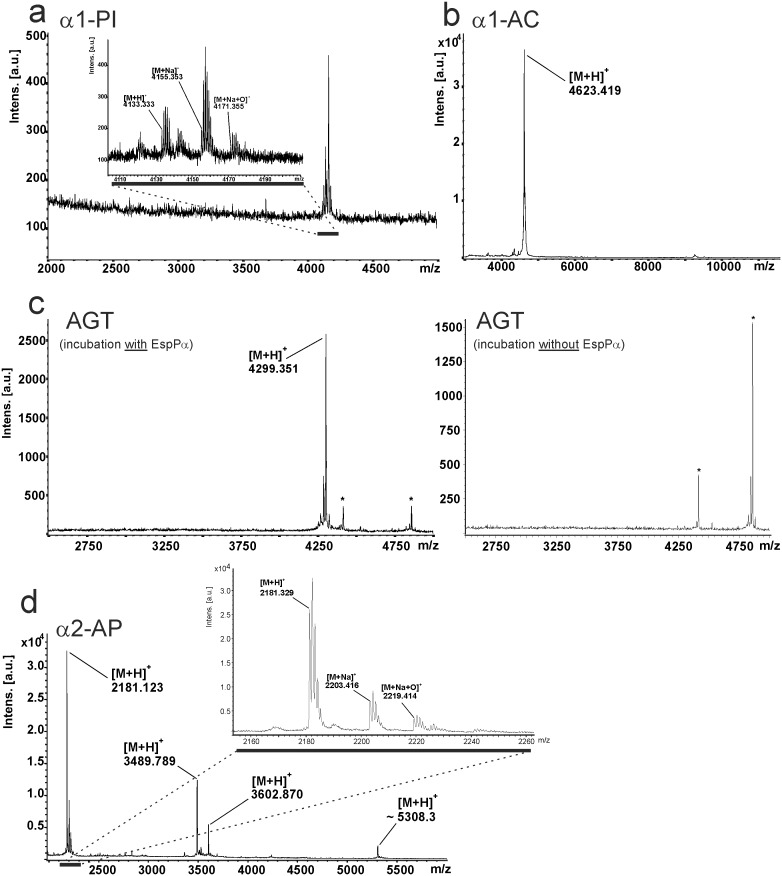
Figure 5. Direct analysis of the small cleavage product of serpins via MALDI-TOF-MS.
Serpins were incubated with EspPα and directly analyzed via MALDI-TOF-MS. a, MALDI-TOF-MS spectrum of α1-PI fragment. Inset: Detailed view of the signal representing the small α1-PI fragment. b, MALDI-TOF-MS spectrum of α1-AC. c, MALDI-TOF-MS spectrum of AGT. Left lane: Spectrum after incubation with EspPα, right lane: Spectrum after incubation of AGT without EspPα. *, signals represent non-proteolytic fragments also found after incubation of AGT without EspPα. d, MALDI-TOF-MS spectrum of α2-AP. Inset: Detailed view of the m/z window 2160–2260 representing signals (M H), (M Na), (M Na+O) of the cleavage site in the N-terminal extension of α2-AP are exemplarily shown. (M H), proton adduct of small serpin fragment, (M Na), Na adduct of small serpin fragment, (M Na+O), Na adduct oxidized at one methionine residue.

