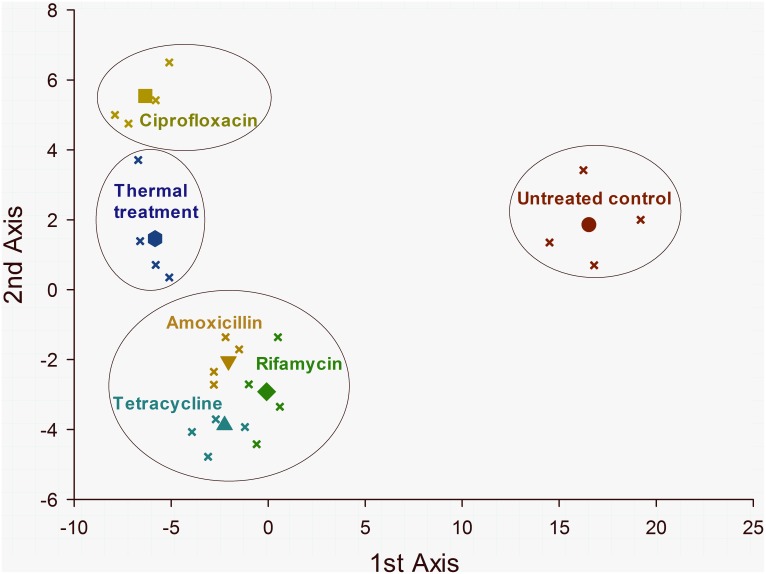
Figure 2. Ordination (CVA) diagram showing the divergence in behavioral traits of maize weevils (Sitophilus zeamais) exposed to different endosymbiont-reducing treatments (see Table 2).
Both canonical axes are significant and account for 97.45% of the total variance explained. The solid symbols are centroids of treatments representing the class mean canonical variates and the smaller symbols of the same color represent the individual replicates. The large circles indicate clusters of treatments that are not significantly different by the approximated F-test (P<0.05), based on the Mahalanobis (D2) distance between class means.

