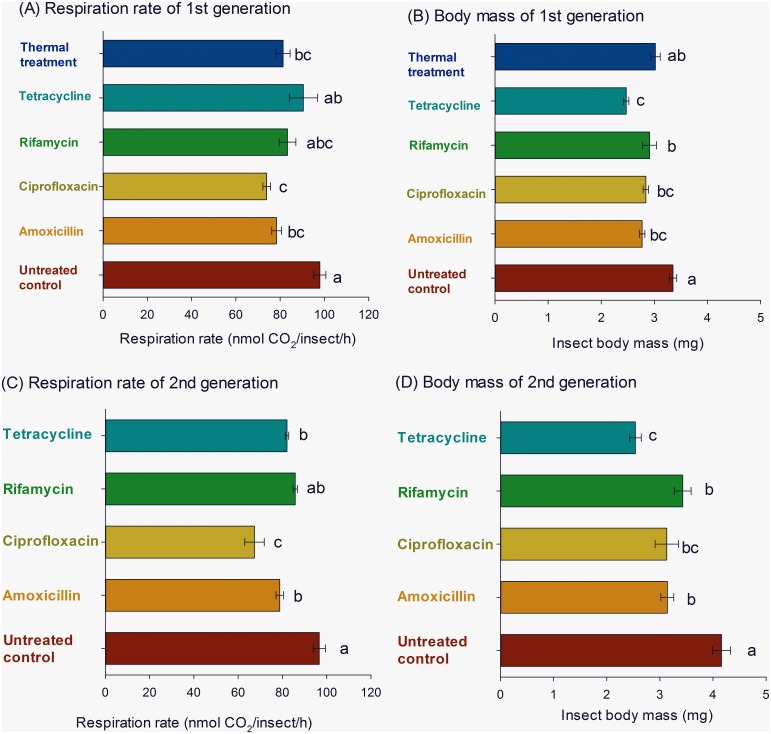
Figure 3. Respiration rate (A, C) and body mass (B, D) (± SE) of F1 (A, B) and F2 progenies (C, D) of maize weevils (Sitophilus zeamais) exposed to different endosymbiont-reducing treatments.
Means followed by the same letter in a histogram are not significantly different by Tukey’s HSD test (P<0.05).

