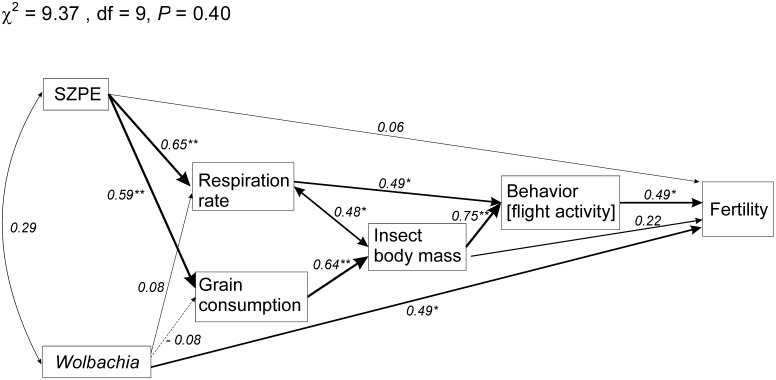
Figure 7. Path analysis diagram for the influence of the endosymbiont load of SZPE and Wolbachia on the respiration rate, grain consumption, body mass, behavior (flight activity, and fertility of the maize weevil (Sitophilus zeamais).
The result of χ2 goodness-of-fit for the path model is indicated. One-headed arrows indicate causal relationships (regression), while doubled-headed arrows indicate correlation between the variables. Significance levels are represented by asterisks (*P<0.05, **P<0.01), and the thickness of each line is proportional to the strength of the relationship. Solid arrows indicate positive relationships, while dashed arrows indicate negative relationships. Direct, indirect and total values for path coefficients are fully presented in Table 5.

