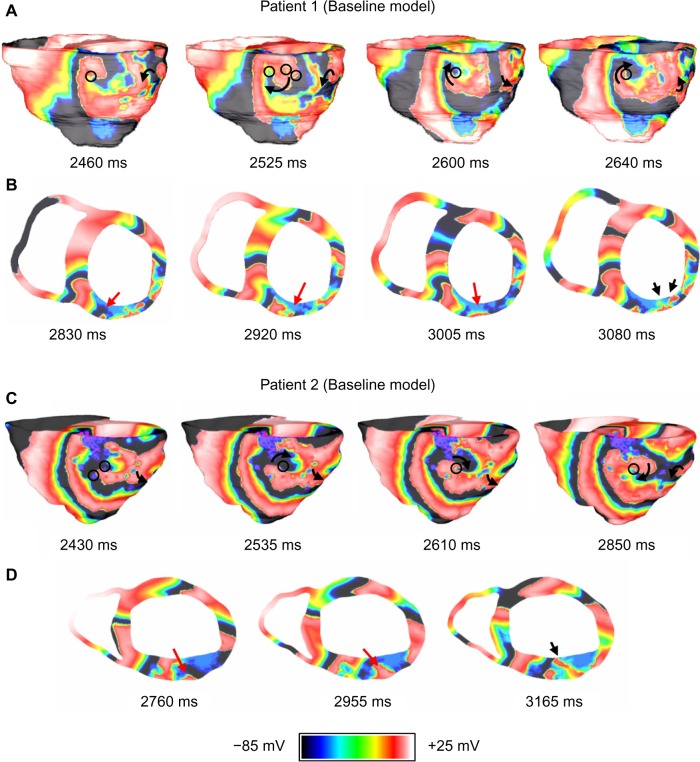
Figure 5.
VT reentry patterns on Patient 1 and Patient 2 baseline models. (A) Anatomical reentry anchored to fibrosis in Patient 1. The black circles indicate fibrotic tissue; (B) Epicardial activations are conducted transmurally around blockages and through narrow channels formed within fibrosis (red arrows) to produce focal activations on endocardium (black arrows); (C) Anatomical reentry anchored to fibrosis in Patient 2. The black circles indicate fibrotic tissue; and (D) Epicardial activations are conducted transmurally through narrow channels formed within fibrosis (red arrows) to produce focal activations on endocardium (black arrow).

