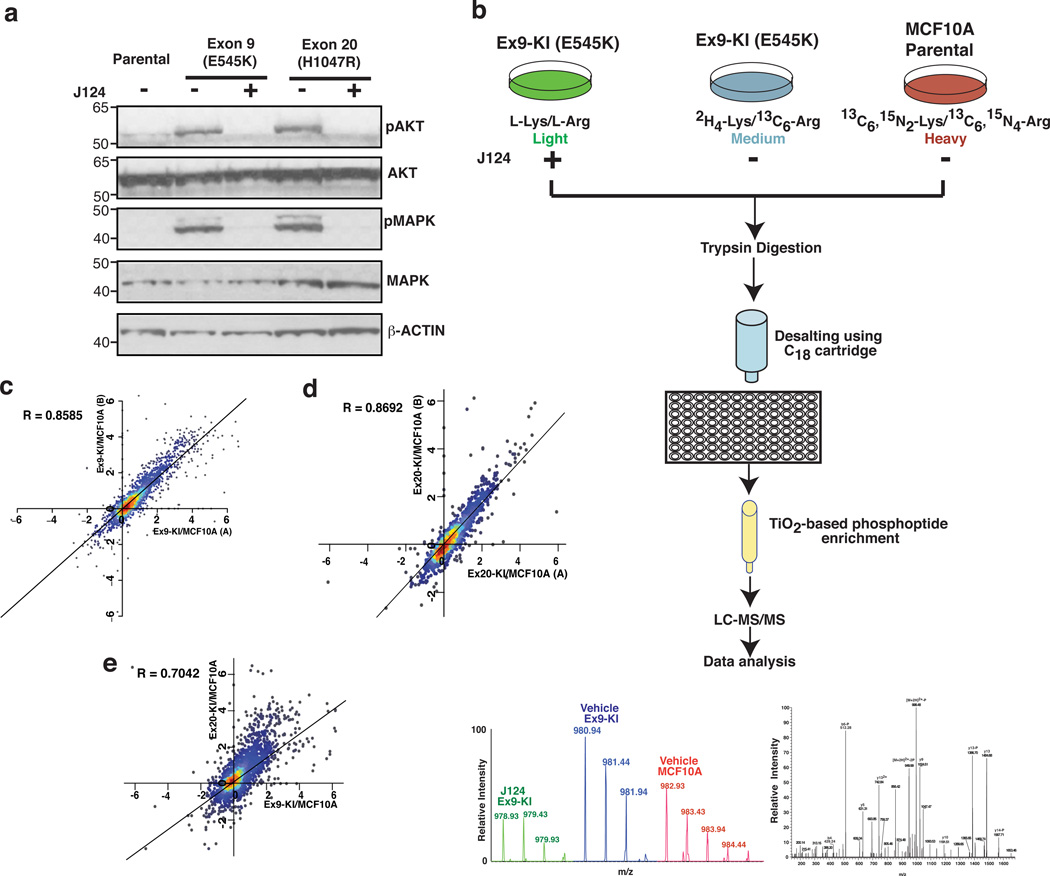
Fig. 1.
Phosphoproteomic analysis of MCF10A cells with PIK3CA mutations. (a) Western blot analysis of phosphorylated AKT (pT308), total AKT, phosphorylated p42/44 MAPK (pThr202/Tyr204) and total p42/44 MAPK in MCF10A parental cells, Ex9-KI and Ex20-KI cells with or without J124 treatment. (b) A schematic depicting the strategy used for quantitative phosphoproteomic profiling of PIK3CA Ex9 knockin mutant cells. (c, d) Density scatter plot of log2 transformed phosphopeptide ratios (Ex9-KI or Ex20-KI vs. MCF10A) from two SILAC reverse-labeled biological replicates. (e) Density scatter plot of log2 transformed phosphopeptide ratios (x axis: Ex9-KI vs MCF10A and y axis: Ex20-KI vs MCF10A). Pearson coefficient correlation (R) is indicated.

