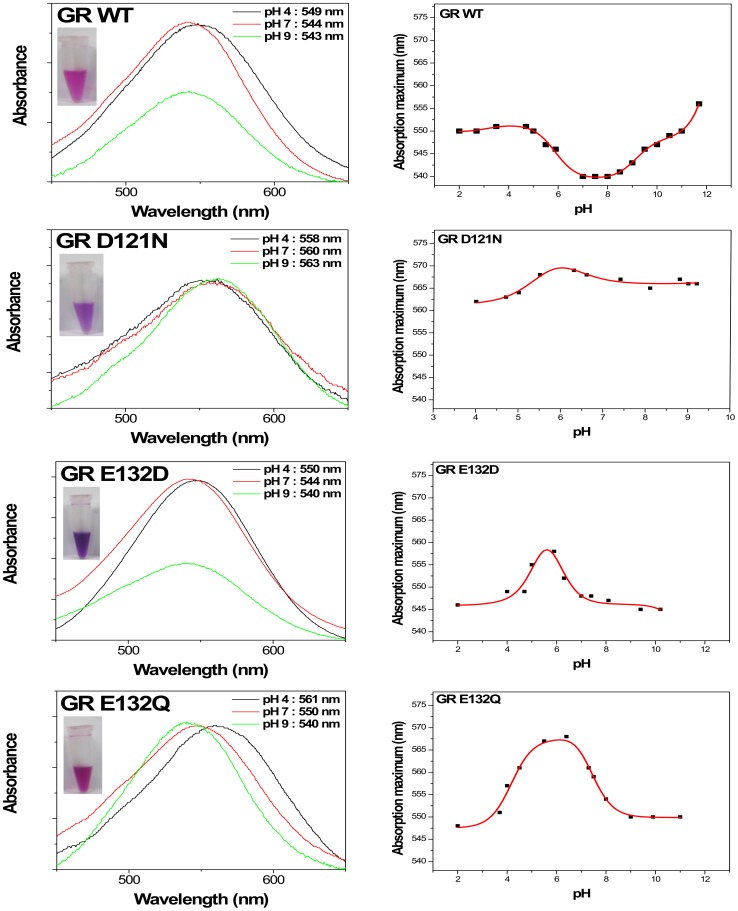
Figure 2. Absorption spectra and titration curves of GR and its mutants.
Insets show photos of purified WT and mutant GR in 50 mM Tris (pH 7), 150 mM NaCl, and 0.02% DDM. The pH titration curves indicate the pH dependence of the absorption maxima of broad spectral range. The pKa values are shown in the table 1.

