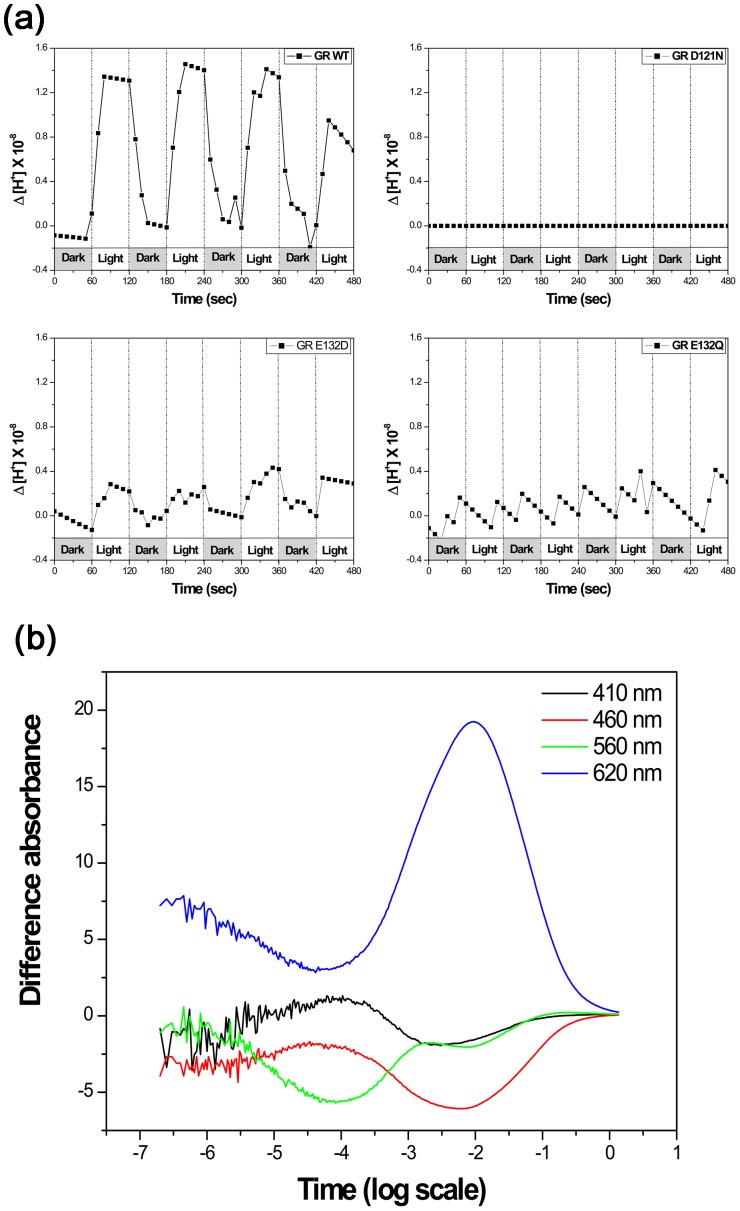
Figure 3. Proton pumping activity and photocycle kinetics.
(a) Light induced proton fluxes in E. coli vesicles containing wild type and mutant GR. Initial pH values were adjusted to7. The buffering capacity was calibrated and the pH changes were recalculated into proton concentrations. (b) Photocycle kinetics of the wild-type GR measured in polyacrylamide gel-encased, DM-treated membranes at 22°C, in 100 mM NaCl, 50 mM KH2PO4, pH 8. This figure gives overallcharacteristics of the photocycle with the differential absorption measured at 620 nm for theK and O intermediates, 410 nm for the M intermediate, 460 nm for the L intermediate, and 560 nm for the parent state and the N intermediate. See the full photocycle description in [20].

