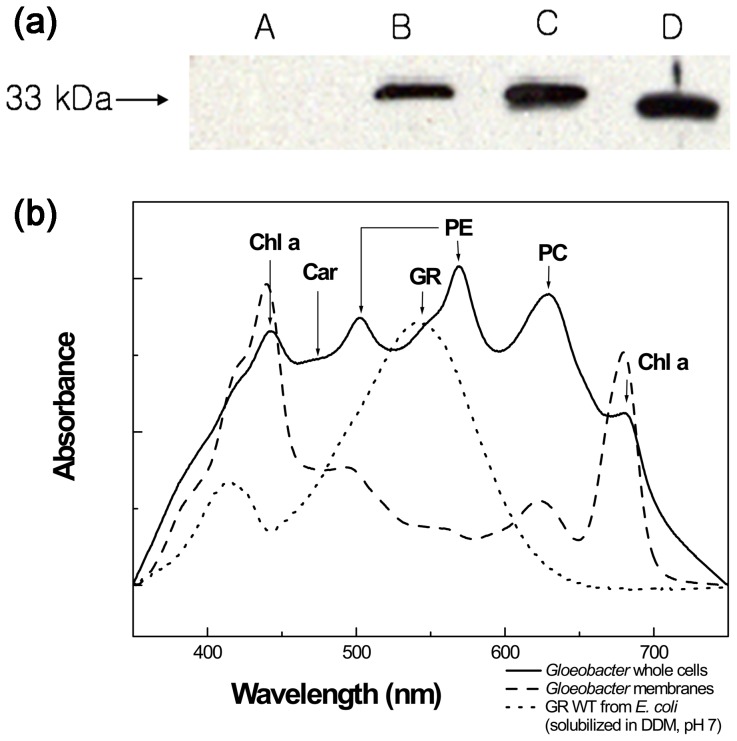
Figure 4. Immunoblot and spectroscopy analysis.
(a) Immunoblot analysis of the Gloeobacter cells and the His-tagged GR protein. The immunoblot used anti-GR antibody for the membrane protein fraction of Gloeobacter cells and anti-His-tag antibody for the protein expressed in E. coli. The whole cells (C) were sonicated and lysates were ultracentrifuged. The lysates were separated into supernatant (A: soluble protein) and pellet (B: membrane protein). D: purified GR from E. coli. (b) Absorption spectra of intact cells and membranes of G. violaceus. The spectrum of G. violaceus is shown with solid line. Chl a (chlorophyll a), Car (carotenoid), PE (phycoerythrin), GR, and PC (phycocyanin) are marked by the arrows. The spectrum of G. violaceus membrane is shown by the dashed line. The spectrum of purified GR in 0.02% DDM, isolated from E. coli is shown by dotted line.

