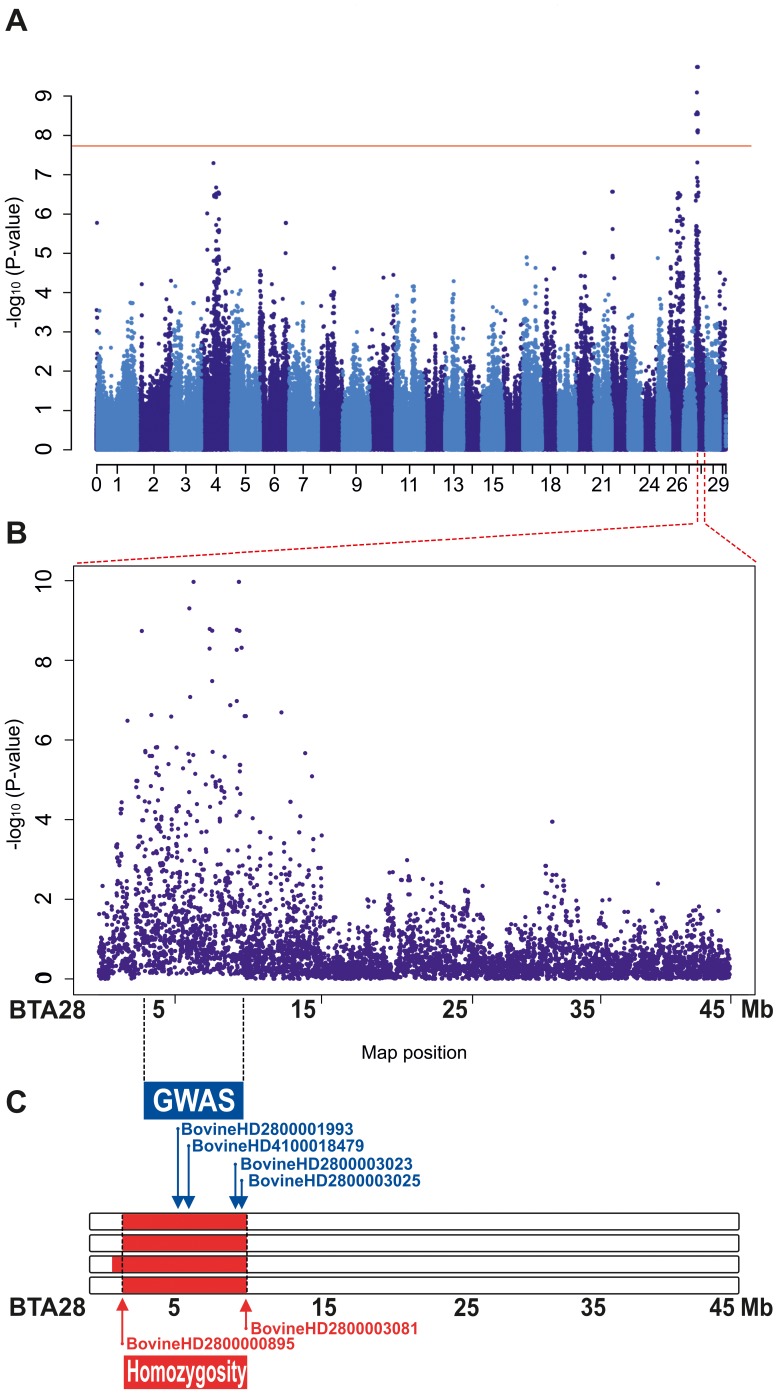
Figure 3. Mapping of the cataract mutation to BTA 28.
(A) Results of the genome-wide association study (GWAS): Manhattan plot showing the negative log of the raw P values calculated with the mixed-model genotypic association test. Genome-wide significance thresholds are indicated (P≤0.01, solid red horizontal line at 7.7 10−8 –log10Pvalue). (B) Detailed view of Manhattan plot for chromosome 28. (C) (blue) the 4 most significantly associated BTA 28 SNPs from GWAS in combination with the identical by descent (IBD; red) segments of the four affected animals. The names of the SNPs lines are reported along with their positions on the map.

