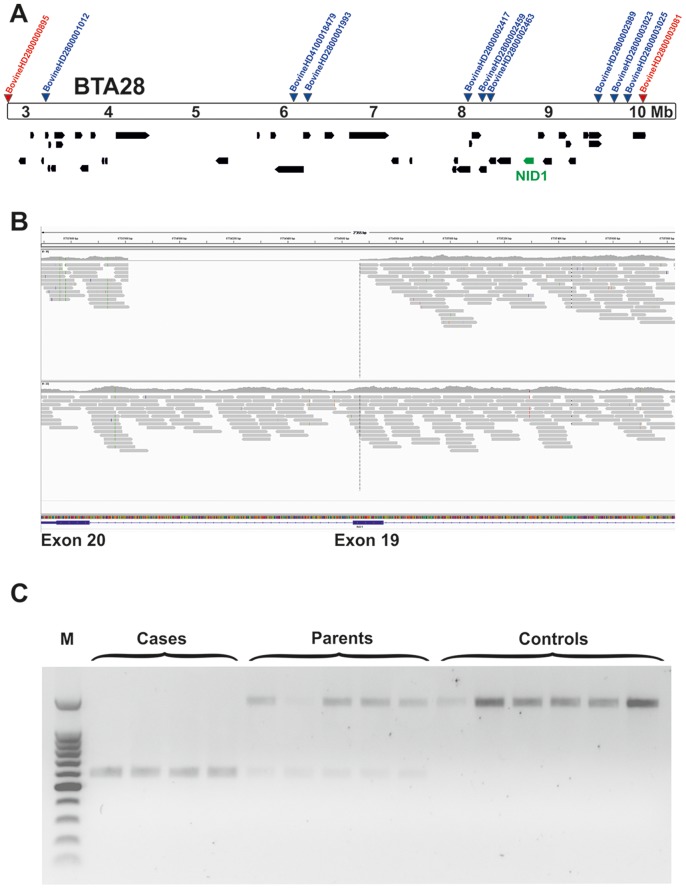
Figure 4. The NID1 deletion.
(A) Gene content of the fine-mapped critical interval Position of the two extreme homozygous marker (red) from homozygosity mapping and of the nine most significant markers from GWAS (blue) are indicated. Annotated genes in the region are shown in black, along with NID1 (green). (B) Screenshot of the next generation sequence reads mapped against the reference sequence. Note the 855 bp deletion. (C) Detected genotypes of the NID1 deletion. Note the shorter PCR product in affected animals, the longer in controls and the presence of both products in carriers.

