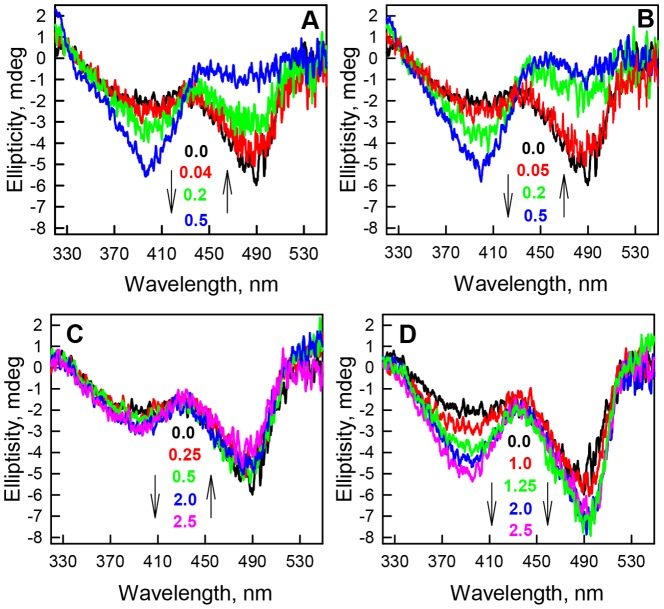
Figure 3. The effect of ionic denaturants and salts on the CD in the visible range of sfGFP.
(A) CD spectra of sfGFP in the visible-UV region were recorded at final GTC concentrations of 0.0 (black line), 0.04 (red line), 0.2 (green line), and 0.5 M (blue line). (B) CD spectra of sfGFP in the visible-UV region were recorded at final NaSCN concentrations of 0.0 (black line), 0.05 (red line), 0.2 (green line), and 0.5 M (blue line). (C) CD spectra of sfGFP in the visible-UV region were recorded at final GdnHCl concentrations of 0.0 (black line), 0.25 (red line), 0.5 (green line), 2.0 M (blue line) and 2.5 M (pink line). (D) CD spectra of sfGFP in the visible-UV region were recorded at final NaCl concentrations of 0.0 (black line), 1.0 (red line), 1.25 (green line), 2.0 M (blue line) and 2.5 M (pink line).

