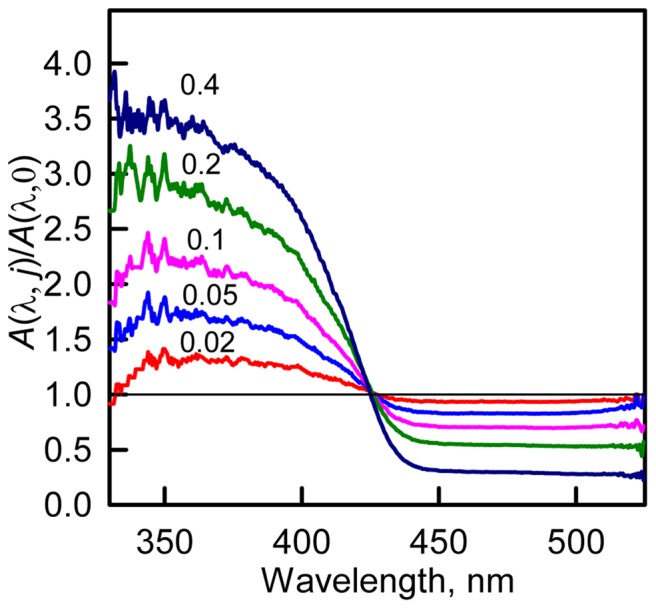
Figure 5. The change of the ratio of  .
.

The dependences calculated on the base of absorption spectra of sfGFP in the buffered solution and in the presence of 0.02, 0.05, 0.1, 0.2 and 0.4 M GTC are shown.
 .
.
The dependences calculated on the base of absorption spectra of sfGFP in the buffered solution and in the presence of 0.02, 0.05, 0.1, 0.2 and 0.4 M GTC are shown.