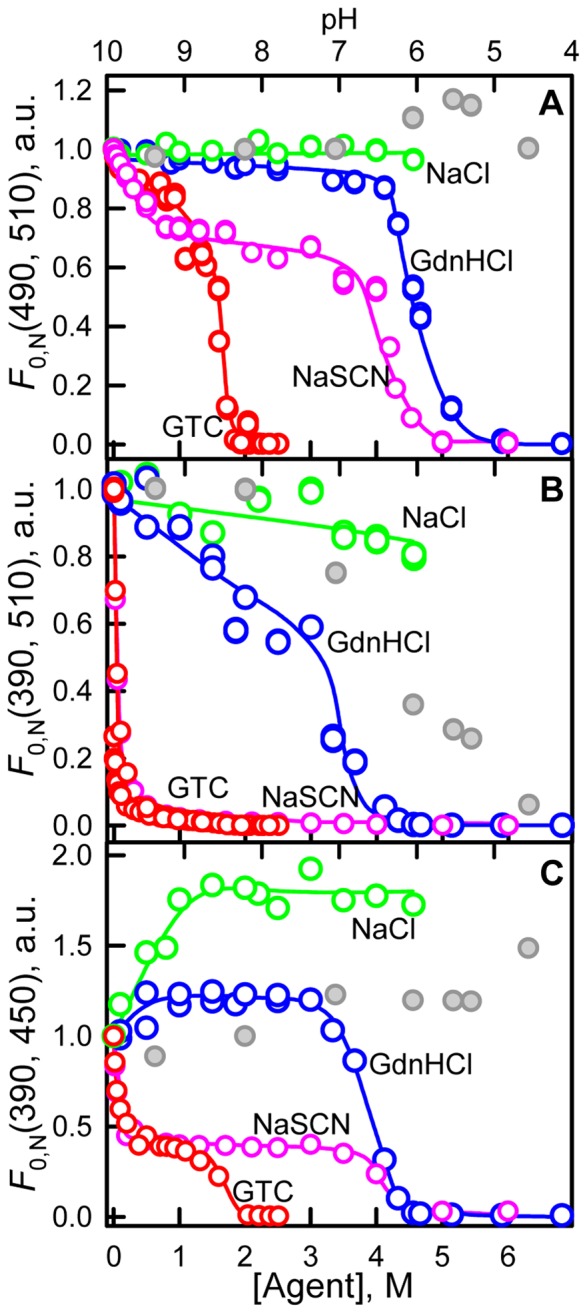
Figure 7. Ionic denaturants and salts effects on fluorescence of anionic and neutral chromophore of sfGFP.

(A) Changes in the chromophore fluorescence intensity upon excitation of anionic chromophore at wavelength of 490 nm and detection at 510 nm. (B) Changes in the chromophore fluorescence intensity upon excitation of neutral chromophore at wavelength of 390 nm and detection at 510 nm. (C) Changes in direct fluorescence from neutral form at 450 nm at excitation wavelength of 390 nm. The value of fluorescence intensity corrected for the primary inner filter effect was normalized to equal chromophore concentration (see “Discussion” section). Agents used were GTC (red circles) and GdnHCl (blue circles), NaSCN (pink circles) and NaCl (green circles). Data on fluorescence intensity of sfGFP in different pH are shown in gray circles, axis of abscissas for these data is on top.
