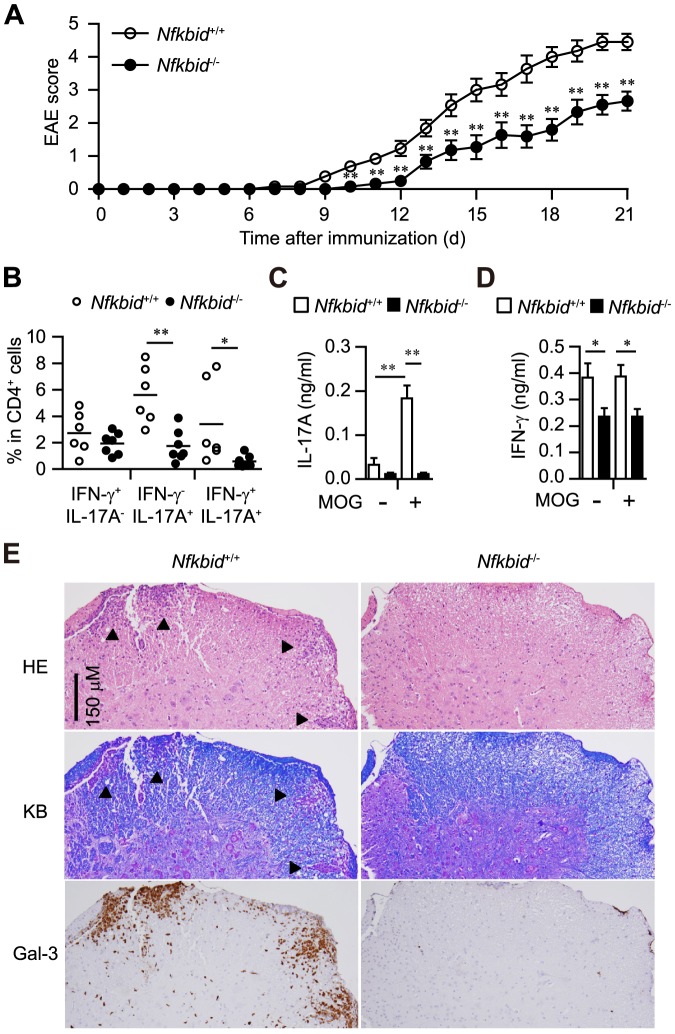
Figure 2. Experimental autoimmune encephalomyelitis (EAE) model in Nfkbiz −/− mice.
(A) Disease progression of EAE in Nfkbiz +/+ (n = 11–13) and Nfkbiz −/− mice (n = 9–11). (B–D) Analysis of mice 12 days after immunization. (B) Cytokine profile of CD4+ cells in draining LNs. (C, D) Measurement of IL-17A (C) and IFN-γ (D) supernatant concentrations by ELISAs (Nfkbiz +/+: n = 5; Nfkbiz −/−: n = 6), using cultured draining LNs incubated in the presence or absence of MOG peptide (10 ng/ml) for 72 h. Data shown represent mean ± S.E. Paired data were evaluated using the Student's t test. *p<0.05, **p<0.01. (E) Histology of spinal cord specimens in EAE models. Twelve days after MOG immunization, Nfkbiz +/+ and Nfkbiz −/− mice were sacrificed and their lumber section of spinal codes were collected. Three-micrometer-thick sections were stained with hematoxylin and eosin (HE), Klüver-Barrera staining (KB) or galectin-3 (Gal-3) immunohistochemistry. Serial sections were used for HE staining, KB staining and Gal-3 immunohistochemistry. Arrowheads in HE staining and KB staining indicate the demyelinated lesions. Data are representative of 3 independent experiments.

