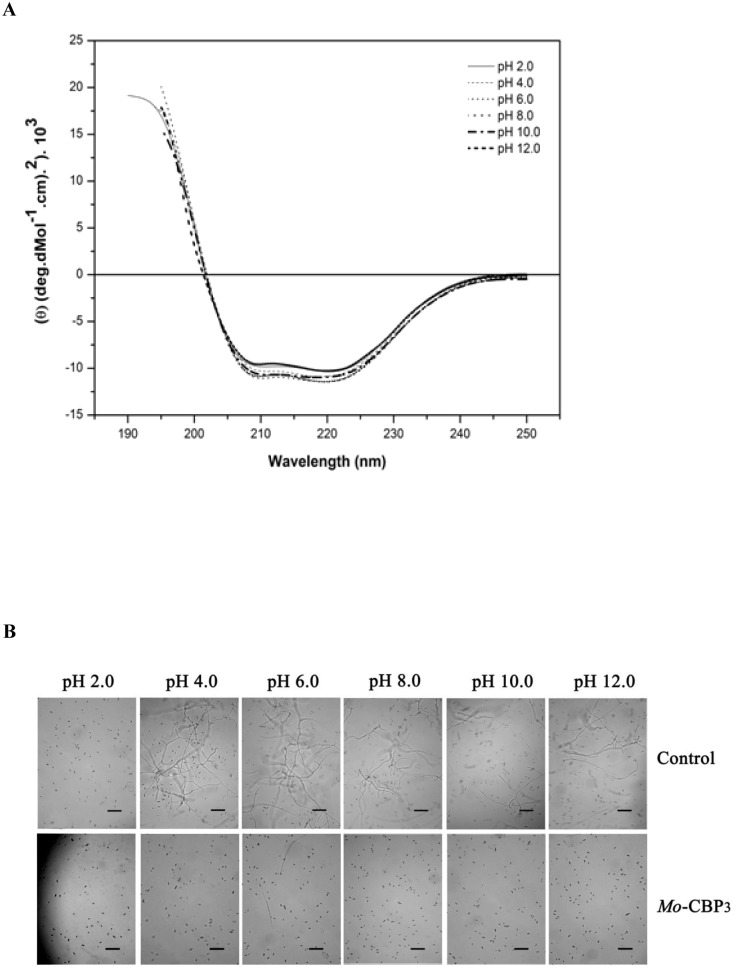
Figure 3. Effect of pH on the conformation and antifungal activity of Mo-CBP3.
(A) Far-UV CD spectra of Mo-CBP3 (2.22 mM) at various pH values. (B) Light micrographs of F. solani spores either in 20 mM sodium acetate-borate-phosphate buffer at different pH values (control) or incubated with Mo-CBP3 (0.1 mg.mL−1) prepared in these buffers. Trials were conducted for 24 h at 22°C in the dark. Bars: 2.5 µm.

