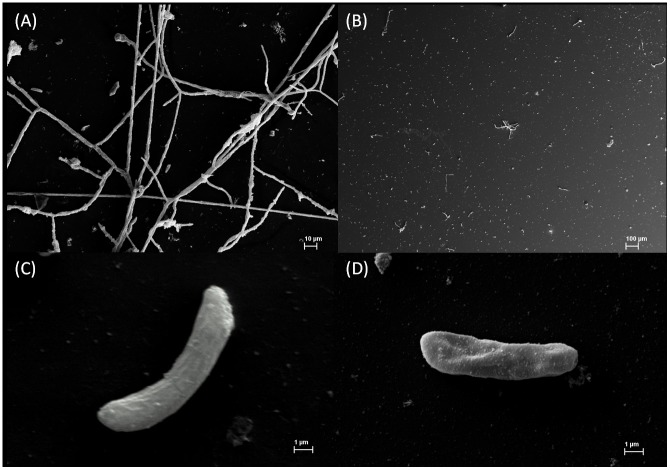
Figure 7. Scanning electron microscopy of F. solani cells.
The cells were cultured either in the absence (A, C) and presence (B, D) of Mo-CBP3 (0.05 mg.mL−1). In (A) the fungus cell has typical growth and developed hyphae in contrast with (B) which shows ungerminated spores and spores that emitted the germination peg, but not developed further. The zooming image of a Mo-CBP3 treated spore (D) shows typical alterations in the cell surface morphology in contrast with control spore (C).

