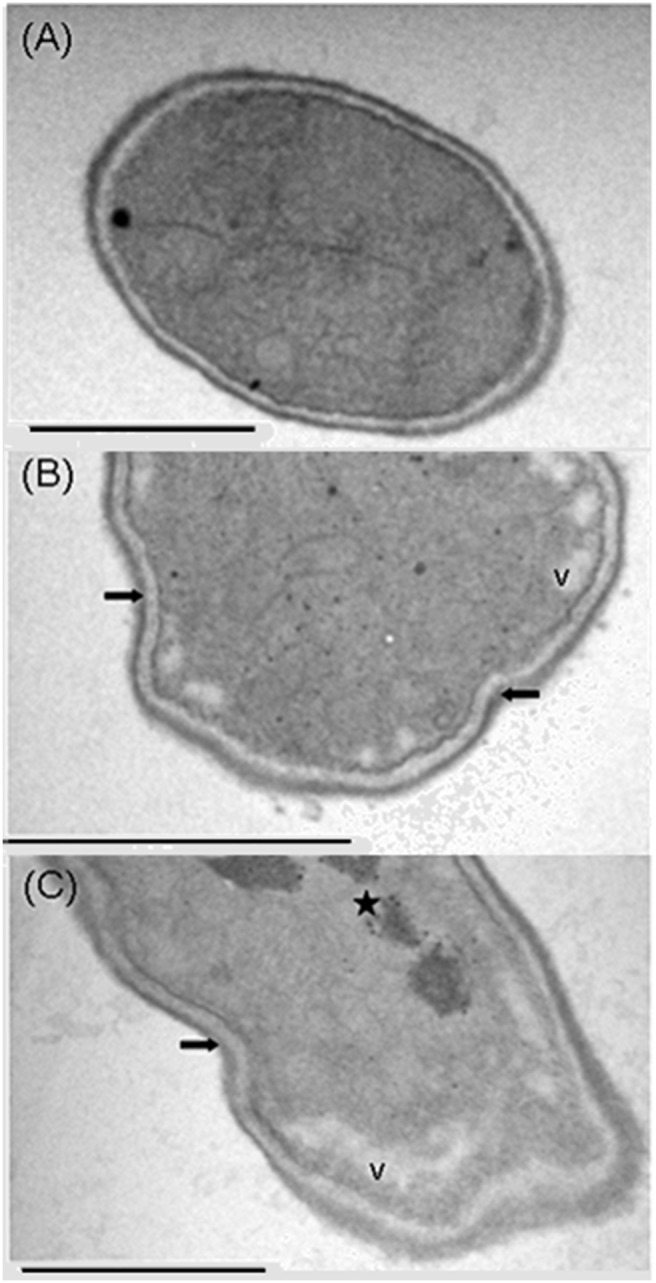
Figure 8. Transmission electron microscopy of F. solani cells.

The cells were cultured either in the absence (A) and presence (B and C) of Mo-CBP3 (0.05 mg.mL−1). Star indicates condensation of the cytosolic content. Vacuole condensation (V) is also shown. Arrows indicate shrinkage of the cell wall. Bars: 0.5 µm (A–C).
