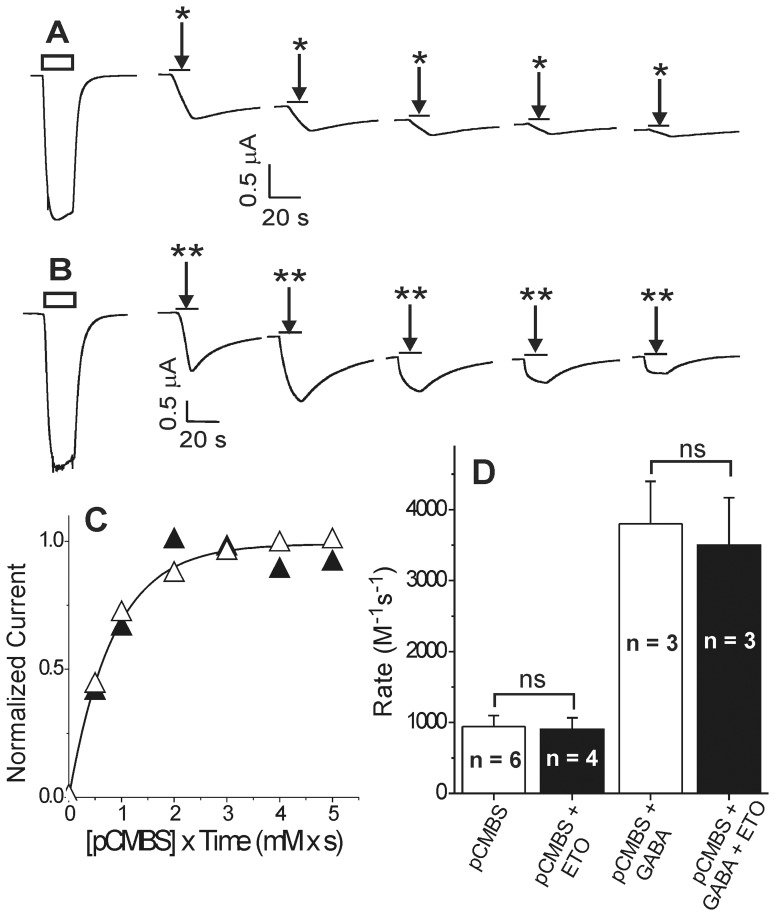
Figure 3. pCMBS modification and lack of etomidate protection in oocyte-expressed α1β2N265Cγ2L GABAA receptors.
Panel A: The first trace is elicited with EC10 GABA (10 µM; white bar) and subsequent traces were recorded during sequential 10 s exposures to 0.1 mM p-chloromercuribenzenesulfonate (pCMBS; arrows; *), followed by wash. Basal currents increase with incremental exposure to pCMBS. Panel B: Traces are from another oocyte. Arrows (**) indicate 10 s exposures to 0.1 mM pCMBS plus 300 µM etomidate, followed by wash. Panel C: Rate analysis of current data from panels A (open symbols) and B (solid symbols) is shown, plotted against cumulative pCMBS exposure time. The line represents a nonlinear least squares single exponential fit to control data (no etomidate). The fitted rate constant is 1200±50 M−1s−1. The fitted rate for protection data (+ etomidate) is 1300±270 M−1s−1. Panel D: Average ± sd pCMBS modification rates in the absence and presence of 1 mM GABA and/or 300 µM etomidate.

