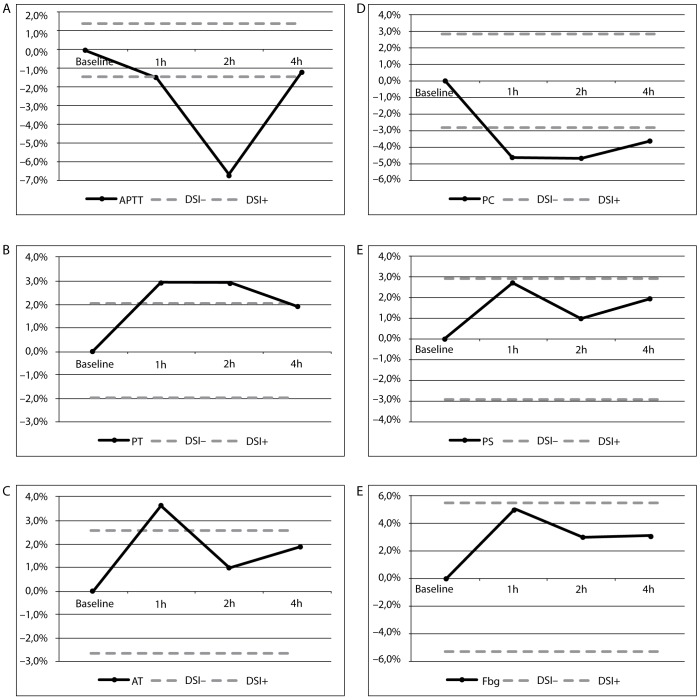
Figure 1.
Lipemia interferograms for (A) APTT, (B) PT, (C) AT, (D) PC, (E) PS, (F) Fbg.
Hours after light meal (x-axis) are plotted against bias values (y-axis). Solid line – bias. Dashed lines - acceptable criteria based on desirable specification for imprecision (DSI) derived from biologic variation.
APTT - activated partial thromboplastin time; PT - prothrombin time; AT - antithrombin III; PC - protein C; PS - protein S; FbG - fibrinogen; DSI - desirable specification for imprecision derived from biologic variation.

