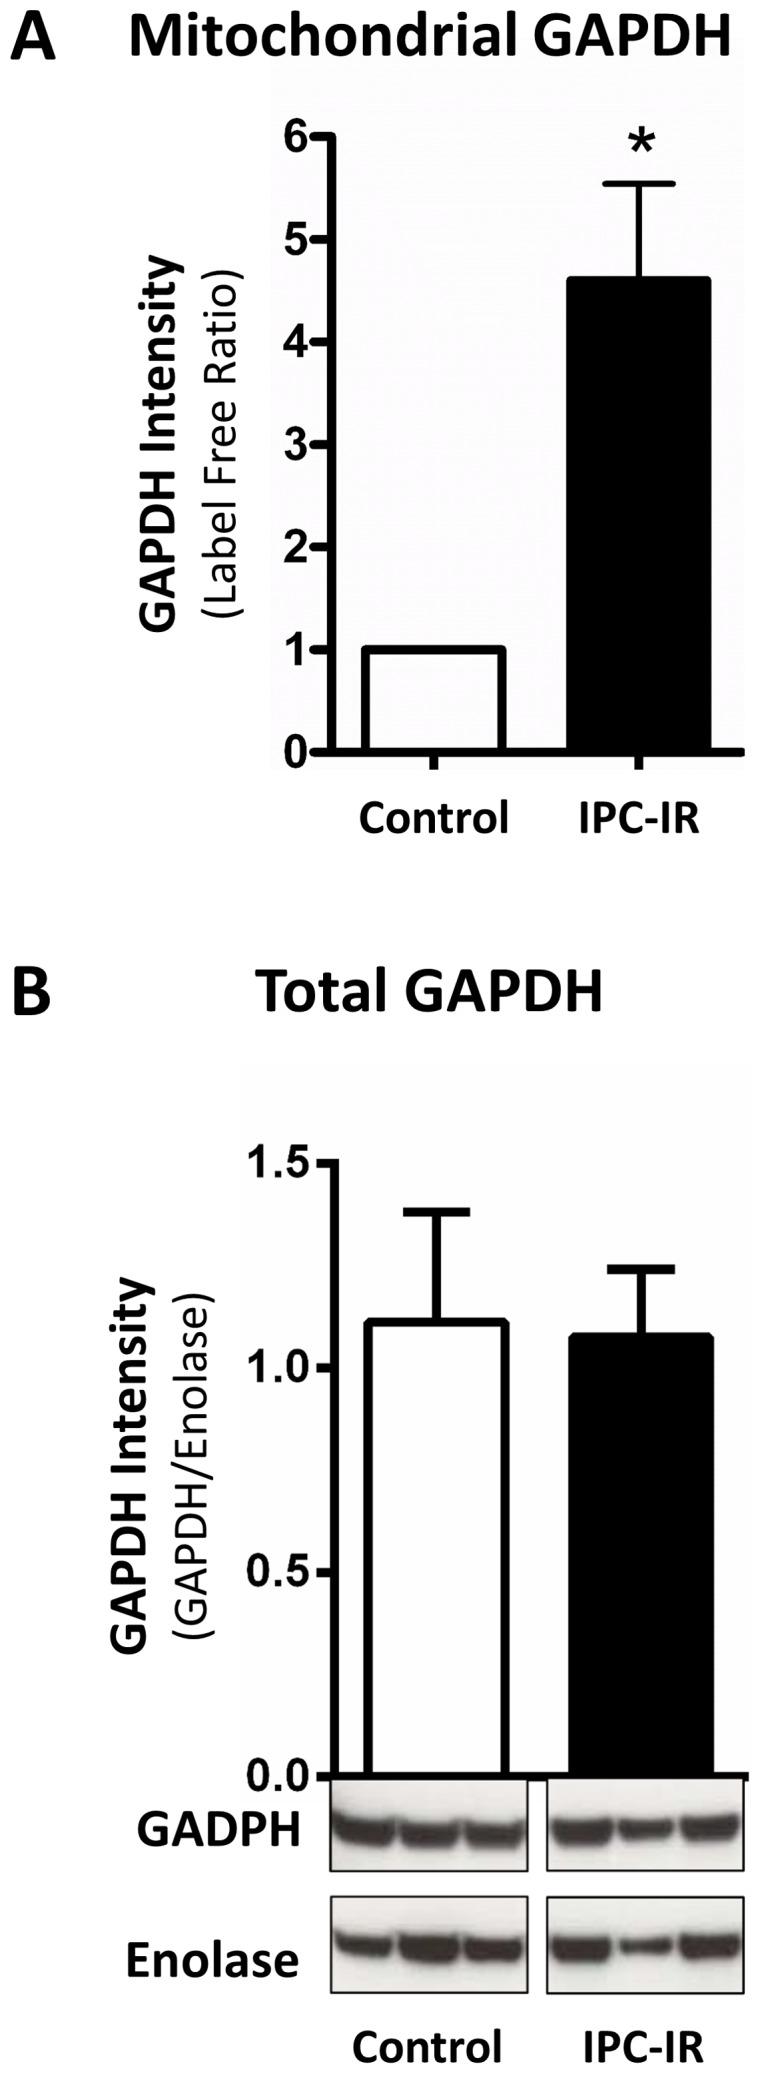
Figure 2. Mitochondrial GAPDH and total GAPDH levels following cardioprotection.

(A) GAPDH protein levels in the mitochondrial fraction of hearts subjected to control or an IPC-I/R protocol were assessed via liquid chromatography-tandem mass spectrometry, followed by label-free peptide quantification (*p<0.05 vs. control, n = 3). (B) Total GAPDH protein levels in hearts subjected to control or an IPC-I/R protocol were assessed via western blot analysis. Representative western blots are shown for total GAPDH (upper) and enolase (lower) in whole heart homogenates together with the densitometry of GAPDH normalized to enolase (n = 3).
