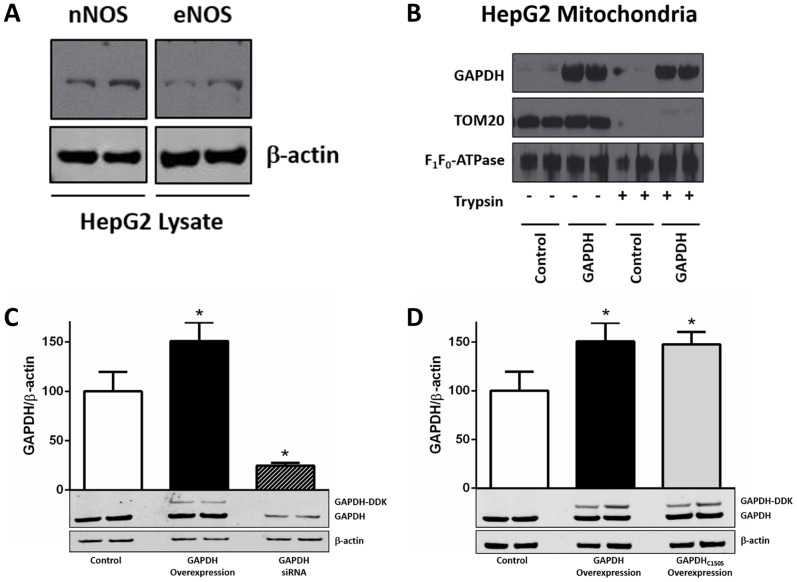
Figure 6. HepG2 cell line as a model system for examining GAPDH as a trans-S-nitrosylase.
(A) Expression of neuronal and endothelial isoforms of NO synthase in HepG2 cells. Representative western blots are shown for neuronal (top right) and endothelial (top left) NO synthase and β-actin (lower). (B) Mitochondrial GAPDH protein levels were assessed after the addition of purified GAPDH to isolated HepG2 mitochondria. Representative western blots for GAPDH (upper), TOM20 (center), and the α subunit of F1F0-ATPase (lower) in HepG2 mitochondria. Control: non-treated mitochondrial control; GAPDH: purified GAPDH treated mitochondria; (n = 3). (C) and (D) Hep2G cells were transfected with either a control GFP plasmid or siRNA scramble, a plasmid encoding DDK-tagged GAPDH for overexpression, a GAPDH siRNA for knock-down, or a plasmid encoding DDK-tagged GAPDHC150S for overexpression. Representative western blots are shown together with the densitometry of GAPDH normalized to β-actin for total GAPDH (upper; GAPDH, GAPDH-DDK, GAPDHC150S-DDK) and β-actin (lower; *p<0.05 vs. control; n = 6).

