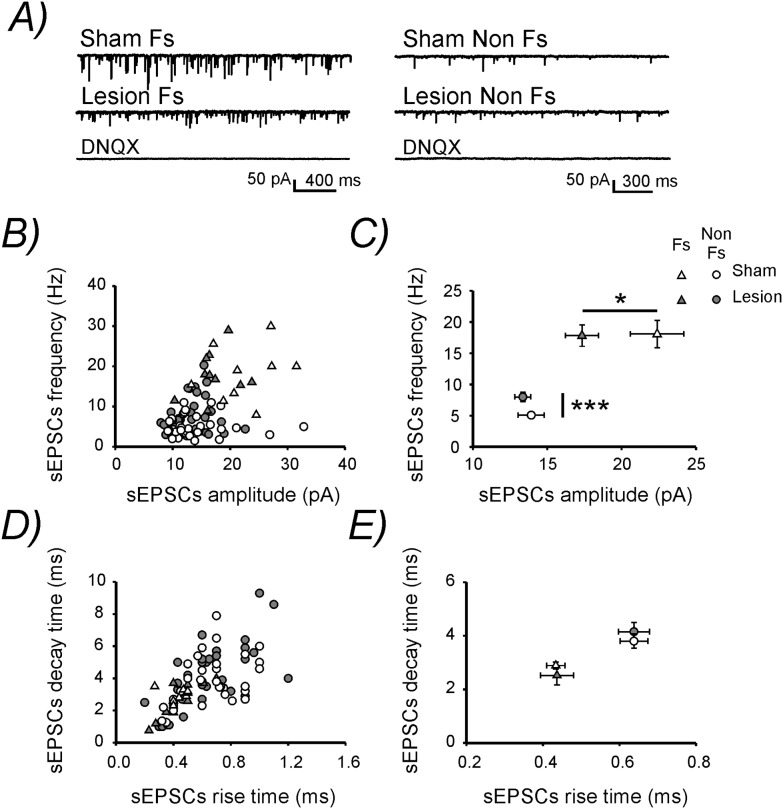
Figure 5. Lesion-induced changes in spontaneous excitatory synaptic inputs onto interneurons.
A) Representative sEPSCs traces recorded at −60 mV in Fs (left) and Non Fs (right) layers 2/3 interneurons. The application of DNQX (20 µM) abolished all signals confirming that they were due to the activation of AMPA receptors. B) Plot showing sEPSCs frequency versus sEPSCs amplitude in each recorded neuron. C) Mean sEPSCs frequency and amplitude in each experimental group. D) Plot showing sEPSCs decay time versus sEPSCs rise time in each recorded neuron. E) Mean sEPSCs decay and rise time in each experimental group.

