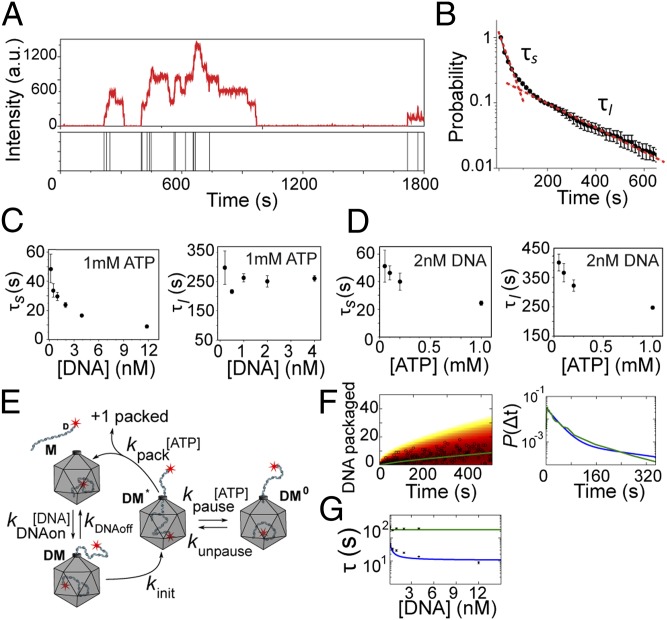
Fig. 2.
Kinetics of packaging initiation in bursts. (A) Fluorescence intensity time trace of a single packaging complex as it packages multiple DNA molecules over 30 min. The bars in the lower panel denote when a new DNA molecule is packaged. (B) Normalized probability distribution of packaging initiation times for preassembled packaging complexes in the presence of 1 mM ATP and 4 nM DNA. The data are fitted to a double exponential function (red dashed line). Error bars represent ± SEM from three independent measurements. (C) The short and long timescales (τs and τl) determined from double exponential fit as shown in B as a function of DNA concentration and in the presence of saturating ATP concentration (1 mM). Error bars represent ± SEM (n ≥ 3). (D) τs and τl as a function of ATP concentration and in the presence of 2 nM DNA. Error bars represent ± SEM (n ≥ 3). (E) Depiction of a packaging model in which DNA binding triggers a conformational change that activates the motor. The activated complex then either packages the DNA or enters a paused state. (F) The fit obtained from the proposed model in E (blue line) to the experimental data for the number of packaged DNA molecules over time (Left, open circles) and the packaging time distribution (Right, green line). (G) Prediction of the model in E for the short packaging time (blue line) and long packaging time (green line) as a function of DNA concentration.

