Fig. 4.
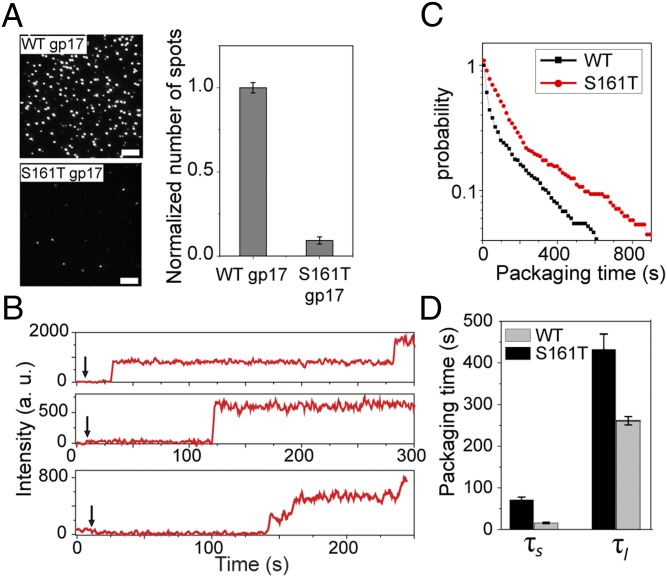
Quantifying the initiation kinetics of slow ATPase mutants. (A) gp17 mutants with ATPase defects cannot initiate packaging efficiently. Representative images of the surface containing the same number of heads preassembled with the WT gp17 (Upper) or csS161T mutant gp17 (Lower) and after incubation with 2 nM DNA and 1 mM ATP for 20 min. (Scale bars, 5 μm.) The graph (Right) shows the average number of spots per imaging area area (70 × 35 µm). Error bars represent ± SEM for 50 different imaging areas. (B) gp17 mutants with ATPase defects exhibit longer initiation times. Typical fluorescence intensity time traces of individual packaging complexes with csS161T gp17 mutant. The arrow denotes when 4 nM DNA and 1 mM ATP were applied. (C) Normalized probability distribution of packaging initiation times for WT and csS161T gp17 mutant and the long and short packaging times for packaging complexes with WT gp17 or csS161T mutant (D) in 4 nM DNA and 1 mM ATP.

