Fig. 1.
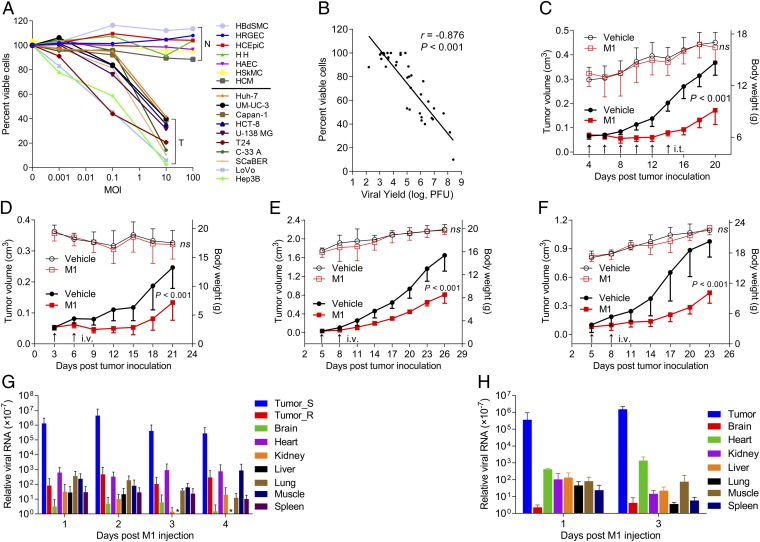
Selective oncolytic efficacy of M1 in vitro and in vivo. (A) Cell viability assays were performed on a panel of cancer cell lines and primary normal cells 48 and 96 h after exposure to M1, respectively. N, primary normal cell; T, tumor cell. (B) Viral titers (MOI = 0.1 pfu per cell; 36 h) and cell viability (MOI = 10 pfu per cell; 48 h) in various infected cell lines. Virus was collected from both supernatant and cell lysate; r is the Pearson correlation coefficient. (A and B) Values are means of three independent experiments. (C–F) Tumor growth (solid symbols) and body weight (open symbols) of tumor-bearing mice. (C and D) Nude, (E) BALB/c, and (F) C57BL/6 mice were treated with either vehicle or M1 intratumorally (i.t.) or i.v. (n = 9 per group). Data are shown in means ± SDs. (G and H) Biodistribution of systemically delivered M1. Viral RNA was quantified by qRT-PCR and normalized to the expression of β-actin. Means ± SDs are shown (n = 6 per group). ns, not significant; Tumor_R, PLC; Tumor_S, Hep3B. * represents not detectable results.

