Fig. 3.
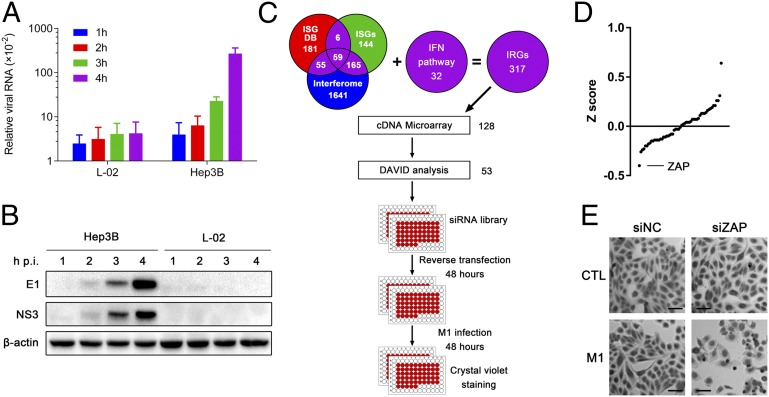
Expression profile and RNAi screening identify zinc-finger antiviral protein (ZAP) as a host factor that contributes to tumor tropism of M1. (A) L-02 and Hep3B cells were treated with M1 (MOI = 10 pfu per cell) for 1–4 h. The levels of viral genomic RNA and endogenous control β-actin were analyzed by qRT-PCR. The graph shows the means ± SDs of the relative level of expression (normalized to endogenous controls) obtained in three independent experiments. (B) Western blot analysis of parallel samples from A. The protein levels of viral structural protein E1 and nonstructural protein NS3 were determined, and β-actin served as a loading control. (C) Schematic representation of systematic identification of host factors that regulate M1 replication. (D) The results of the screen are shown with the siGENOME siRNA pools ranked in order of z score from lowest (decreased cell count) to highest (increased cell count). The position of ZAP is indicated. (E) Phase–contrast images of L-02 cells treated first with siRNA (48 h) followed by M1 infection (MOI = 30 pfu per cell; 48 h) and crystal violet (0.1%) staining. CTL, control; DB, database; hpi, hours postinfection; siNC, negative control siRNA. (Scale bars: 100 μm.)

