Fig. 4.
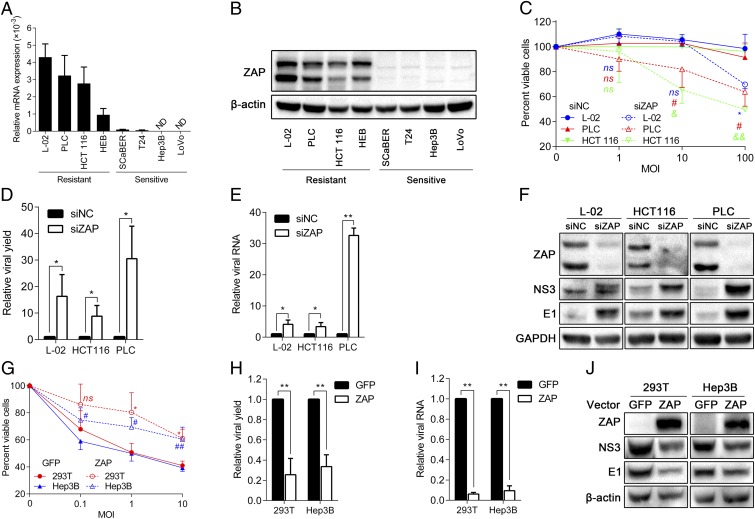
The sensitivity of cancer cells to M1 requires ZAP deficiency. (A) mRNA levels of ZAP in different cell lines normalized to the expressions of β-actin and TBP. Means ± SDs of three independent experiments are shown. (B) Protein levels of ZAP in different cells. β-actin was used as a loading control. (C–F) Resistant cells transfected with siNC or siZAP were infected with M1 for 48 h. (C) Cell viability evaluated by MTT assay, (D) viral yield determined by TCID50 assay, (E) viral RNA quantified by qRT-PCR, and (F) viral protein analyzed by Western blot are shown. (G–J) Sensitive cells were transfected with plasmids expressing GFP (negative control) or ZAP for 48 h and infected with M1 for 48h. (G) Cell viability, (H) viral yield, (I) viral RNA, and (J) viral protein were measured by respective methods. Data are means ± SDs from three independent experiments. (C–E and G–I) All are compared with respective control groups. (C and G) Each color represents one cell line. ND, not detectable; ns, not significant; siNC, negative control siRNA; TBP, TATA box binding protein; TCID50, median tissue culture infective dose. *P < 0.05; **P < 0.01; #P < 0.05; ##P < 0.01; &P < 0.05; &&P < 0.01.

