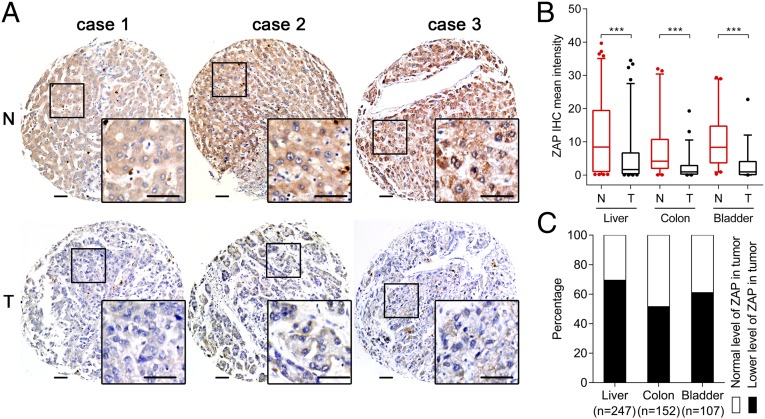
Fig. 6.
Distribution of ZAP deficiency in clinical cancer specimens. (A) Representative cores of ZAP immunostaining in TMA. Higher magnification shown in the box. (Scale bars: 50 μm.) (B) Statistical analysis of IHC staining intensity. Box-and-whisker plots showing median (horizontal line), interquartile range (box), and 5th–95th percentiles (whiskers) of the data. Dots indicate outliers. ***P < 0.001. (C) Distribution of ZAP deficiency in cancers. N, nonneoplastic; T, tumor.

