Fig. 3.
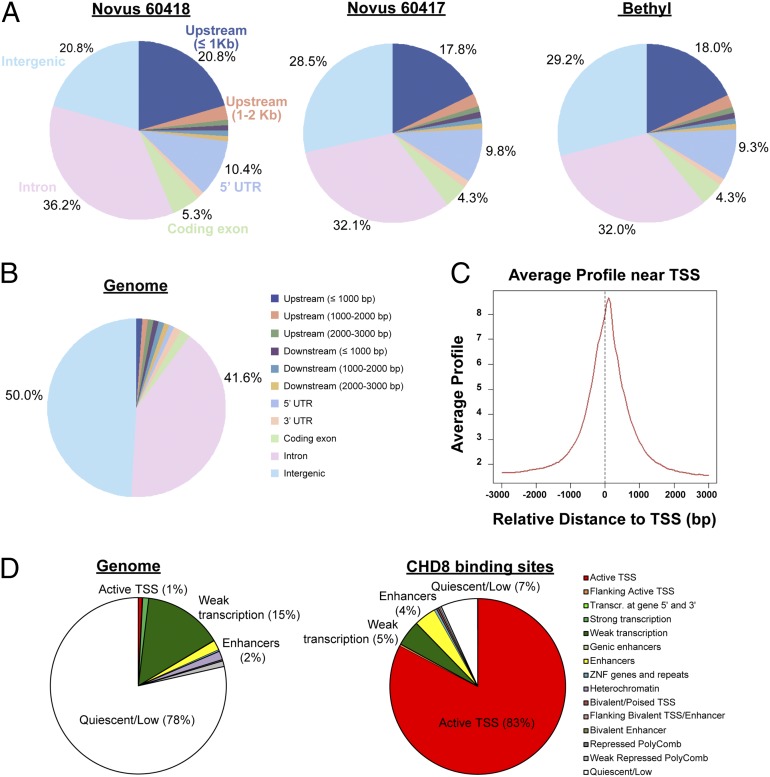
Distribution of ChIP-seq peaks from three CHD8 antibodies. (A) Genomic distribution of sequence peaks captured by each of the three antibodies, compared with the whole genome. Upstream regions are defined as regions upstream of the TSS; the 5′ UTR is the region between the TSS and the coding start site. (B) Whole-genome distribution of the genomic features in A. “Intergenic” refers to anything that does not fall into any of the preceding categories in the legend shown on the right. (C) ChIP-seq read density relative to TSSs for one representative antibody (Novus 60417). We found 7,324 peaks that were detected by all three antibodies. These peaks were mapped to 5,658 genes. (D) Distribution of chromatin states identified by the Roadmap Epigenomics consortium (21) in an ES cell-derived NPC for the whole genome (Left) and the 7,324 CHD8-binding sites detected by all three antibodies (Right).

