Fig. 4.
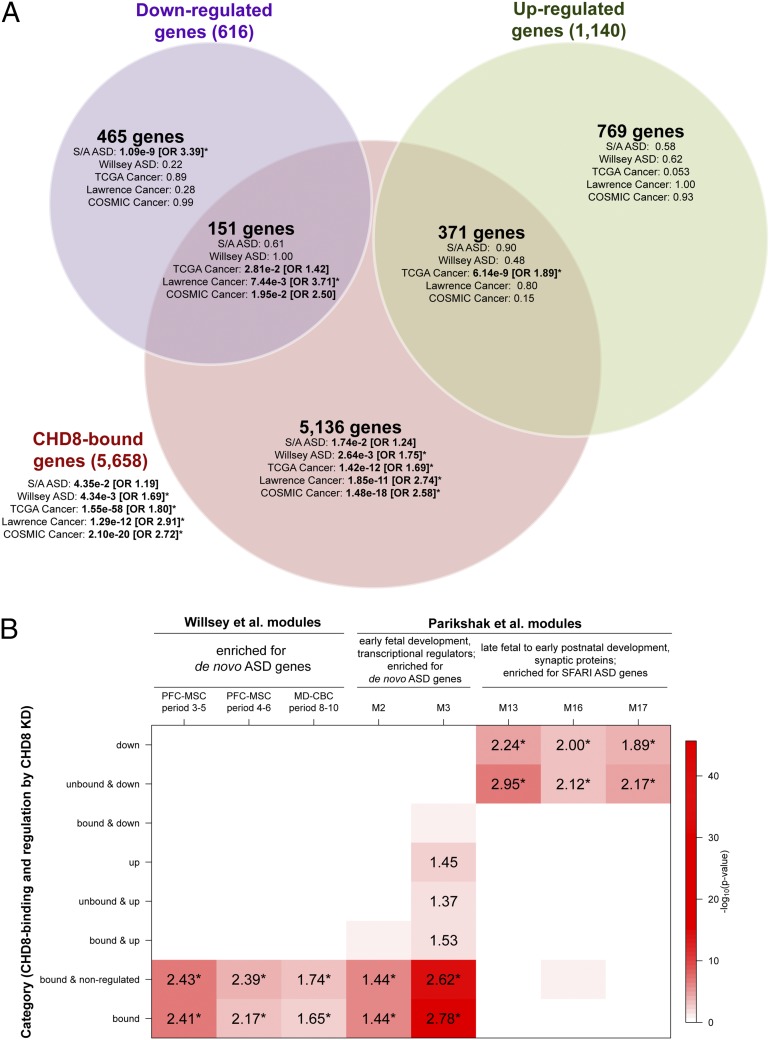
Enrichments for ASD and cancer gene sets and published BrainSpan coexpression networks among CHD8-regulated and CHD8-bound genes. (A) Gene-set enrichments are shown for the sets of genes that are both differentially expressed and bound by CHD8, differentially expressed only, or CHD8-bound only, shown as a Venn diagram. Enrichments for the set of all genes bound by CHD8, independent of differential expression, are shown outside the Venn diagram. For each set of genes in the Venn diagram, enrichment P values are shown for five disease gene lists. ORs are shown for enrichments that met P < 0.05, with asterisks indicating enrichments that met q < 0.05. Disease gene lists were obtained from SFARI and AutismKB (S/A ASD), de novo LoF mutations in ASD are from Willsey et al. (26) (Willsey ASD), TCGA gene ranker (TCGA Cancer), the pan-cancer exome sequencing study by Lawrence et al. (13) (Lawrence Cancer), and the Wellcome trust (“COSMIC Cancer”), as described in SI Materials and Methods. All gene-set analyses and Benjamini–Hochberg-corrected P values are provided in Dataset S8A. (B) For each set of CHD8-regulated or CHD8-bound genes, enrichments are shown for overlap with BrainSpan coexpression modules generated by Willsey et al. (26) and Parikshak et al. (25) that had been found to be enriched for ASD genes. The red shading in each cell corresponds to the log10 P value for enrichment, as shown in the color scale on the right. The number in each cell is the OR for enrichment, shown only if the enrichment met P < 0.05. Enrichments that met q < 0.05 are indicated by an asterisk next to the OR. Names of coexpression modules are as reported in the respective publications.

