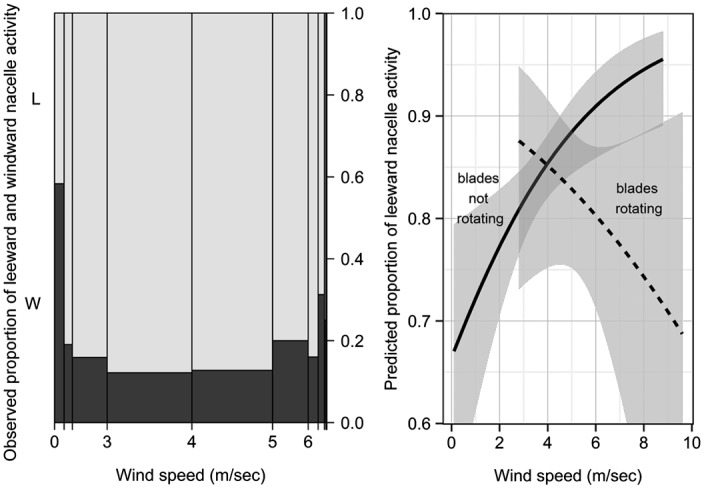
Fig. 2.

Spineplot (Left) depicts the proportion of observed bat activity as a function of wind speed (m/s) in leeward (L; light gray) and windward (W; dark gray) areas near the turbine nacelle. Spineplot bar widths are proportional to the number of observations within each wind-speed interval, with wider bars representing more observations (n = 208 in the 3–4 m/s category) and narrower bars representing fewer observations (n = 6 in the >8 m/s category). Predicted proportion of leeward activity (mean and 95% confidence interval) derived from logistic regression (Right) illustrates the significant interaction of wind speed and blade rotation (where curtailment prevented turbine blades from rotating on some nights).
