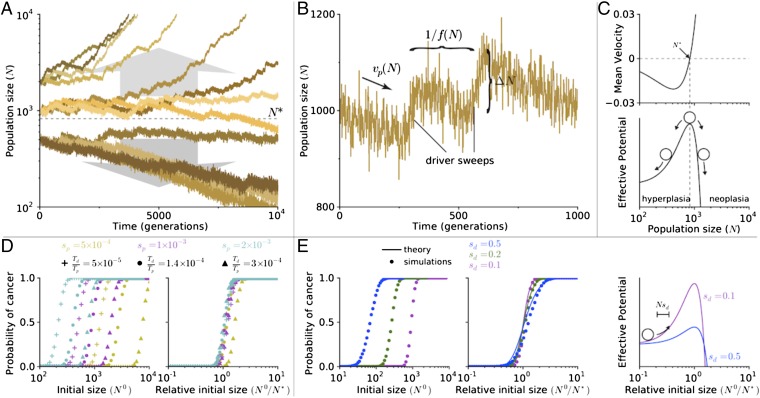
Fig. 1.
Tug-of-war between drivers and passengers leads to a critical population size. (A) Population size verses time of simulations initiated at various sizes (N0 = 500, 1,000, or 2,000). For all simulations presented in this paper, μ = 10−8, Td = 1,400, Tp = 107, sd = 0.1, and sp = 0.001 (SI Appendix, Table S1), unless specified otherwise. (B) A segment of a trajectory shows periods of rapid growth and gradual decline. New drivers arrive with a frequency f(N), abruptly increasing the population size by an amount ΔN. Passenger accumulation causes a gradual decline with rate vp. (C) Analytically computed mean velocity of population growth (Upper) and an effective barrier (Lower) as a function of population size N. Velocity is negative below N* and positive above it. (D) The probability of adaptation (cancer) as a function of initial population size N (Left) and a relative initial population size (N/N*; Right) for nine sets of evolutionary parameters. Curves collapse and behave similarly when plotted relative to N*. (E) Same as in D for simulations and theory but for different values of sd. Higher values of sd leads to a more gradual transition from nonadaptive to adaptive regime. In our formalism, an increase in sd results in a larger jump size ΔN and lower potential barrier, allowing more populations to overcome the barrier (Right).

