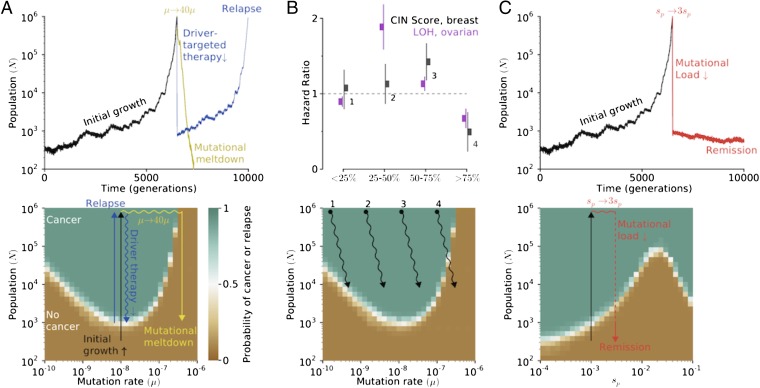
Fig. 4.
Mapping and interpreting treatment outcomes. (A, Upper) An adapted population (cancer) can be reverted to extinction by increasing the mutation rate (mutagenic chemotherapy) or by decreasing the population size (e.g., surgery or cytotoxic chemotherapy). (Lower) Our phase diagrams explain therapeutic outcomes: therapies that alter evolutionary parameters enough to push it outside of the adaptive regime cause continued population collapse; those that do not readapt and relapse. (B, Upper) Cancers with intermediate mutational loads are the most aggressive (31, 33), whereas patients with very high level of chromosomal instability are most effectively treated. (Lower) This result is well explained by our phase diagrams, where cancers with high mutation rates are susceptible to mutational meltdown, yet paradoxical for all previous evolutionary models of cancer. We believe traditional therapies decrease population size and may increase the mutation rate. (C) Threefold increase in the effect of passenger mutations leads to rapid population meltdown below N*, without relapse.

