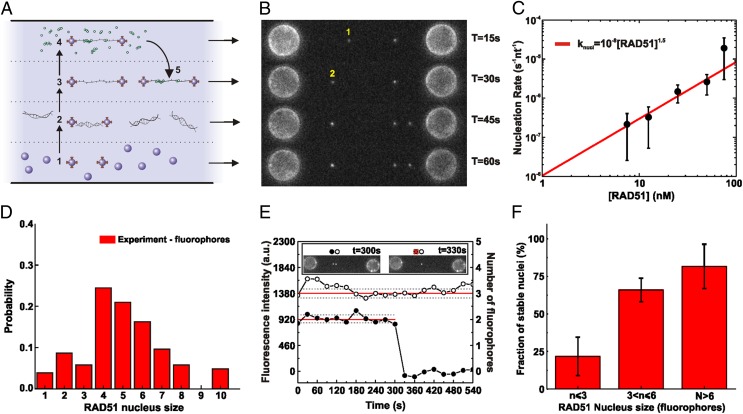
Fig. 1.
Visualization and quantification of RAD51 nucleation on ssDNA using dual optical tweezers, wide-field fluorescence microscopy, and microfluidics. (A) A four-channel microfluidics device was used as a platform for the assembly of the single-molecule assay. Typical experiments proceeded in five steps: (1) trapping of two streptavidin-coated microspheres, (2) tethering of a single dsDNA between the spheres, (3) force-induced conversion of dsDNA into ssDNA (DNA force–extension curves were acquired and checked), (4) incubation in a flow channel with fluorescent RAD51 in solution, and (5) visualization of the RAD51–DNA complex in buffer without RAD51 (occasionally, complete photobleaching of the fluorescent signal was used for RAD51 quantification). To measure long-time behavior, multiple cycles of 4 and 5 were performed on the same DNA substrate. (B) Fluorescence images taken after subsequent RAD51 incubation–detection cycles with the same ssDNA construct; cumulative incubation time is indicated. Indicated are a RAD51 nucleus that binds and unbinds before the next incubation cycle (1) and a nucleus that remains bound and shows an increase in fluorescence intensity due to growth (2). (C) RAD51 concentration dependence of nucleation rate. ●, Experimental data; red line, power law fit (knucl = ko[RAD51]n) yielding an exponent n of 1.5 ± 0.3. The number of incubation measurements was 26 at 7.5 nM, 30 at 12.5 nM, 20 at 25 nM, 29 at 50 nM, and 62 at 75 nM. (D) Histogram of nucleus sizes (RAD51 concentration, 12.5 nM; incubation time, 77 s; total, 105 data points). (E) Fluorescence intensity time traces of individual RAD51 nuclei bound to ssDNA. After incubation with fluorescent RAD51, a fluorescence image was taken of the same ssDNA every 30 s, in the absence of RAD51 in solution (Inset). From such images, fluorescence intensity time traces were determined for individual RAD51. ●, RAD51 nucleus consisting of two fluorophores, detaching between 300 and 330 s; ○, RAD51 nucleus consisting of three fluorophores remaining ssDNA bound for at least 9 min. (F) Bar diagram showing how stable nucleus fraction depends on nucleus size. Stable nucleus fraction was defined as the probability of staying bound to the ssDNA for longer than 6 min. n = 9, 34, 7 for n ≤ 3, 3 < n ≤ 6, n > 6, respectively. Error bars represent normalized counting errors.

