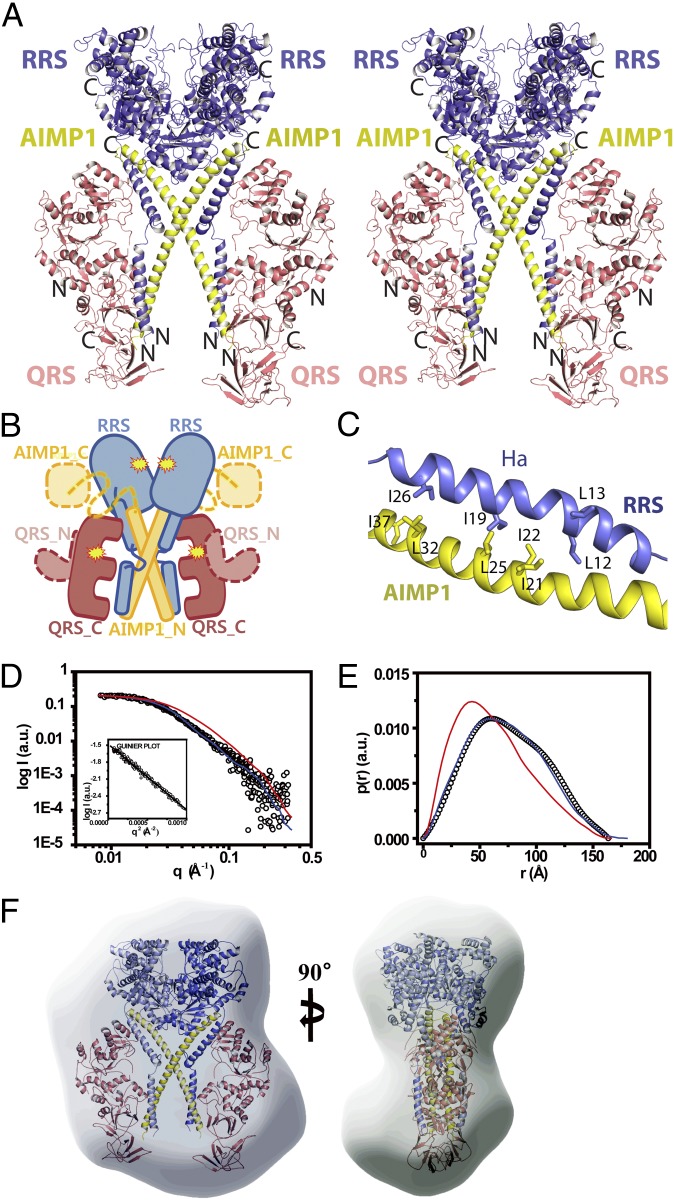
Fig. 2.
Hexameric structure of the RQA1 subcomplex. (A) Stereodiagram of the hexameric RQA1 subcomplex. The figure is shown in the same orientation as in Fig. 1B. (B) A cartoon representation of the overall shape of hexameric RQA1, shown in same orientation as in A. The invisible structures of the N-terminal domain of QRS (orange) and the C-terminal EMAPII domain of AIMP1 (yellow) were modeled. The linker between the N- and C-terminal domains of AIMP1 is indicated by a yellow dashed line. The active sites are marked with stars. (C) Close-up view of the coiled-coil interface between the Ha helix of RRS (blue) and the first half of the AIMP1 helix (yellow) in the hexameric structure. Also see Fig. S7B. (D) The SAXS profile of the solution structure (empty circles) of the RQA1 subcomplex. The solid red and blue lines are the theoretical SAXS curves calculated from the crystal structures of the trimeric and hexameric forms of human ARS, respectively. The solution structures of RQA1 in other concentrations also displayed similar SAXS profiles and are omitted here for clarity. The Guinier plot is shown in the Inset. (E) Pair distance distribution functions [p(r)] for the RQA1 complex based on an analysis of the experimental SAXS data (empty circles). The electron distribution functions for trimeric and hexameric crystal structures are shown by red and blue lines, respectively. (F) Structural superposition of the hexameric RQA1 subcomplex onto the molecular envelope calculated from the SAXS data showing two different views of the model. To compare the overall shape and dimensions, the crystal models were superimposed onto the solution models using the SUPCOMB program (30).

