Fig. 3.
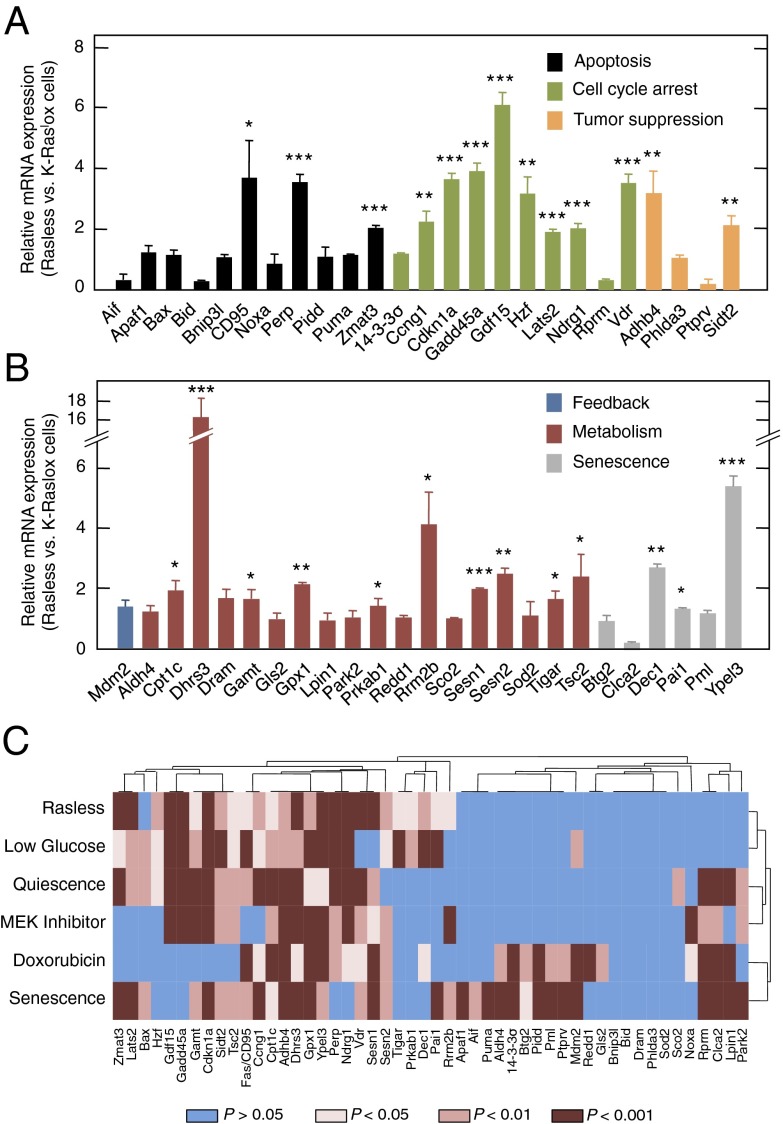
Activation of p53 target genes in Rasless cells. (A and B) qRT-PCR of the indicated p53 target genes in Rasless vs. K-Raslox cells. Genes have been grouped by function, including apoptosis (black bars), cell cycle arrest (green bars), tumor suppression (orange bars), feedback (blue bar), metabolism (red bars), and senescence (gray bars). Data are represented as mean ± SD. *P < 0.05; **P < 0.01; ***P < 0.001 (unpaired Student t test). (C) Heat map of significantly induced genes as determined by qRT-PCR of 50 representative p53 target genes under various stress conditions compared with untreated K-Raslox cells. Stress conditions included loss of Ras gene expression upon incubation of K-Raslox cells with 4OHT for 2 wk (Rasless), exposure to 1 mM glucose for 24 h (Low Glucose), incubation in the presence of 0.1% FBS for 24 h (Quiescence), treatment with 0.4 μM PD0325901 for 24 h (Mek Inhibitor) or with 5 μg/mL doxorubicin for 24 h (Doxorubicin), and replicative senescence of primary K-Raslox MEFs (Senescence). Blue bars, P > 0.05; light brown bars, P < 0.05; medium brown bars, P < 0.01; dark brown bars, P < 0.001 (Student t test).

