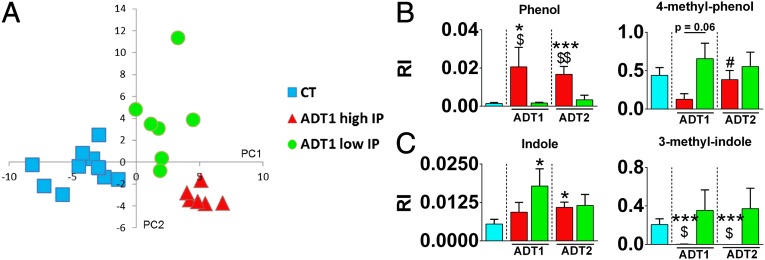
Fig. 5.
Metabolomic profiling of AD subjects with high and low IP. (A) Score plots showing clustering of the metabolite profiles analyzed with partial least squares-discriminant analysis. (B and C) Volatile organic compounds belonging to the chemical classes (B) phenols and (C) indoles. *P < 0.05 compared with CT, ***P < 0.001 compared with CT, $P < 0.05 AD high IP vs. AD low IP at the same study time, $$P < 0.01 AD high IP vs. AD low IP at the same study time, #P < 0.05 compared with ADT1 high IP. AD subjects with high IP and low IP are depicted in red and green, respectively. CT subjects are depicted in blue. AD, alcohol-dependent subjects; CT, control subjects; IP, intestinal permeability; RI, relative indices. T1 and T2 refer to the beginning and end of alcohol withdrawal, respectively.

