
Figure 1. TBI induces a significant macrophage response near the lesion site.
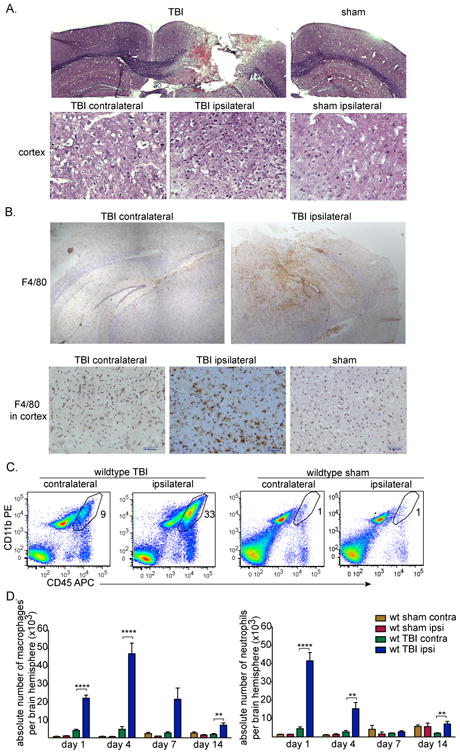
(A) CCI model of murine TBI four days post-surgery. Coronal brain sections were stained with H&E (top). Scale bars represent 500 μm. Images of H&E staining of cortical brain tissues four days after surgery (bottom). Scale bars represent 50 μm. (B) Representative immunohistochemical staining of coronal brain sections for F4/80+ macrophages/microglia (brown) and counterstained with hematoxylin (light purple) four days post-TBI. Images of staining in cortex are also shown (bottom). Scale bars represent 200 μm (top) and 50 μm (bottom). (A-B) Data shown are representative of three experiments performed.
(C) Representative flow cytometry data of brain leukocytes isolated four days post-TBI (n=8) or sham surgery (n=4) that were stained for CD45-allophycocyanin and CD11b-PE. Density plots shown are of live cells that are negative for the Ly6G granulocyte marker. The polygram gate highlights the proportion of macrophages defined as CD45hi CD11b+ Ly6G-Sytox blue- in the total cell preparation. (D) The absolute numbers of macrophages from the contralateral and ipsilateral brain hemispheres quantified by flow cytometry following TBI on days 1, 4, 7, or 14 or sham surgery are shown as mean +SEM of 16 (day 1), 8 (day 4), 4 (day 7), 8 (day 14) or 2-4 (sham) mice. Data shown are pooled from 14 experiments performed. ****p<0.0001, **p<0.005, unpaired t-tests with Welch's corrections.