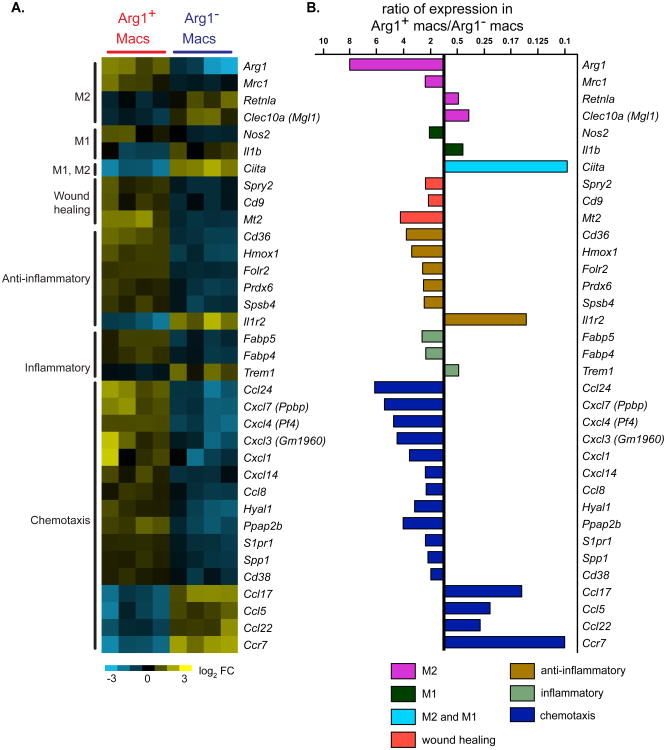
Figure 4. Differences between Arg1+ and Arg1- macrophage subsets and peripheral blood monocytes revealed by gene expression profiling.
(A) Microarray data comparing gene expression by Arg1+ TBI macrophages, Arg1- TBI macrophages, TBI monocytes, and normal monocytes (n=4 per population) were examined in a pairwise analysis. Red and blue color dots represent genes with significant differences. (B) Principal component analysis using the top 15% most variable genes between all populations analyzed by microarray. The distance between the indicated cell populations is proportionate to their differences in gene expression.

