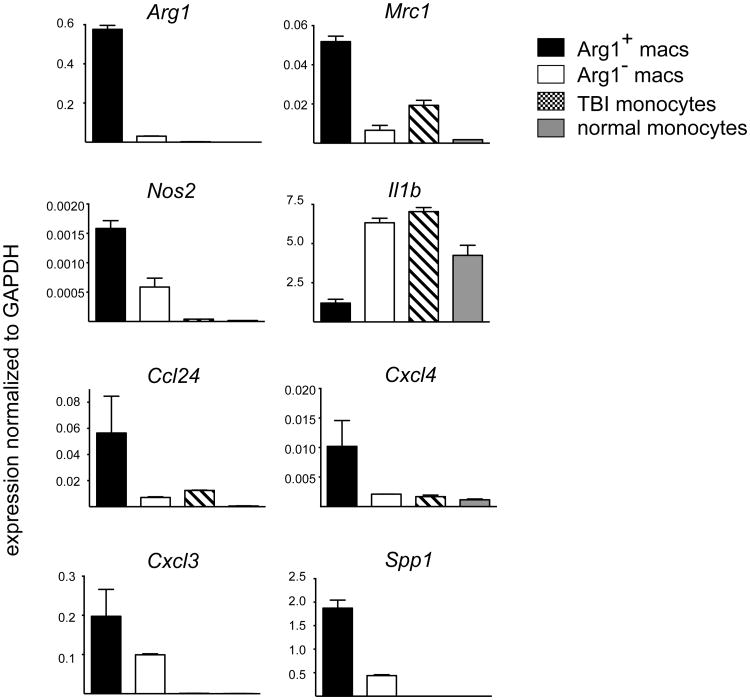
Figure 5. Differences in transcriptional responses between Arg1+ and Arg1- brain wound macrophages selecting for genes associated with M1 and M2 polarization and/or with other selected macrophage functions genes.
(A) Gene expression analysis comparing Arg1+ TBI macrophages and Arg1- TBI macrophages one day after injury. Thirty-five selected genes of interest with significant relative differences of close to two-fold or higher are shown. Each column represents a separate experiment. Gene expression was log2 transformed and median-centered across genes. Yellow represents a relative increase in expression and blue signifies a relative decrease. Expressed genes are grouped by function. (B) Average gene expression differences from the data in Figure 4A were quantified and ratios of gene expression levels comparing Arg1+ brain wound macrophages to Arg1- brain wound macrophages are shown.

