
Figure 1.
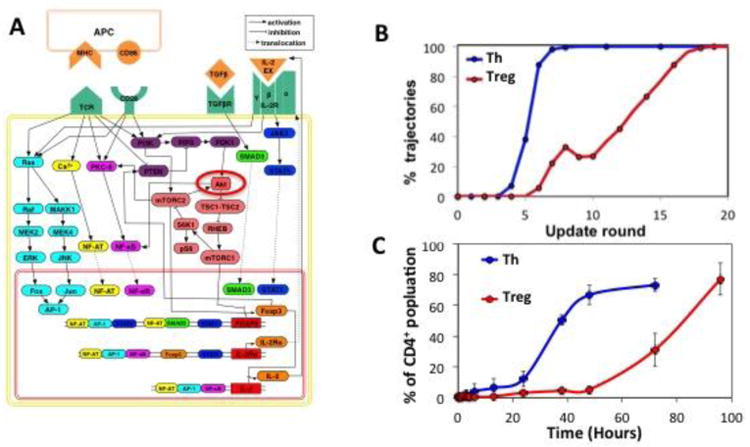
Computational modeling of T cell differentiation. (A) Signaling network governing differentiation. Nodes represent network elements, which include external ligands such as MHC and IL-2, receptors, such as TCR and IL-2R, signaling intermediates such as Ras, Akt, and JAK3, and transcription factors such as AP-1, NF-AT, and FoxP3. Edges represent interactions between these elements with pointed arrowheads representing activation, blunt arrowheads representing inhibition, and dashed lines representing translocation of molecules between cellular compartments. The state of a given element in the network, such as Akt (circled in red) is updated according to the states of its incoming influences – PDK1 and mTORC2 in the case of Akt. (B) Simulated time courses of the percentage of cells destined to become IL-2+ Th cells (blue line) or Foxp3+ Treg cells (red line). In this simulation the TCR signal was interrupted after 6 times steps and the appearance of Th and Treg cells were followed at each time step. Results represent the combined trajectories, from a total of 1000 simulations, leading to Th (390/1000) or Treg (419/1000) outcomes. (C) Corresponding experimental results for percentages of purified CD4+T cells stimulated on plates coated with anti-CD3 antibody at high (blue line) and low (blue line) dose in the presence of soluble anti-CD28 antibody. High dose stimulation results in rapid stabilization of the Th (Foxp3- CD25+) phenotype whereas Treg (Foxp3+ CD25+) cells take much longer to appear in low dose stimulation. Results shown are mean ± SEM of three similar experiments,