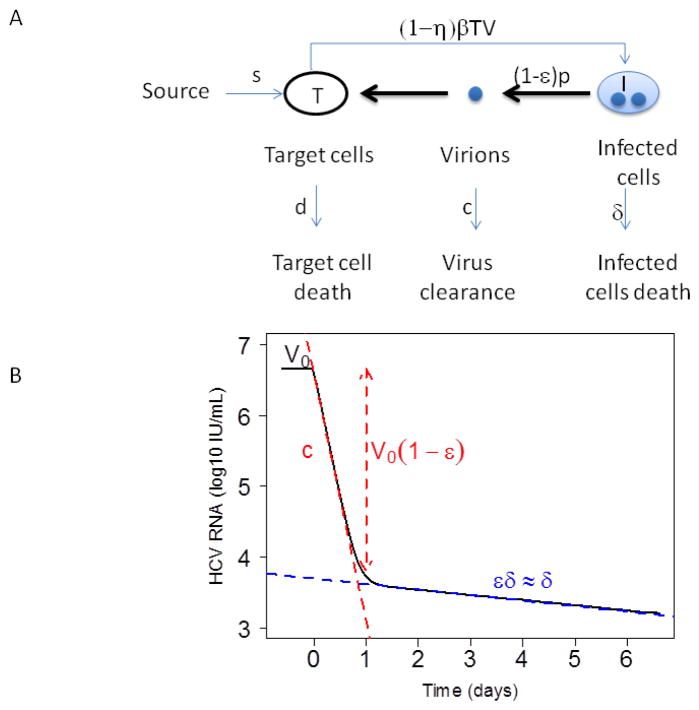
Figure 1. Mathematical modeling of HCV kinetics.
(A) Schematic of the standard model for HCV infection described in the text. Here, target cells, T, are produced from a source at rate s, die at rate d per cell and become productively infected with rate constant β. Infected cells, I, produce virus at rate p per cell, which is cleared at rate c per virion. Infected cells die at rate δ per cell. Antiviral drug therapy is assumed to reduce the infection rate by the factor (1−η) and/or the viral production rate by the factor (1−ε). (B) Example of a biphasic viral decline observed under treatment. Before therapy the viral load is assumed to be at steady state with value V0. Therapy is initiated at time t=0. After a brief delay, the viral load falls exponentially in a rapid first phase, with slope c, to the level V0 (1−ε), followed by a slower second phase decline with exponential slope εδ.

