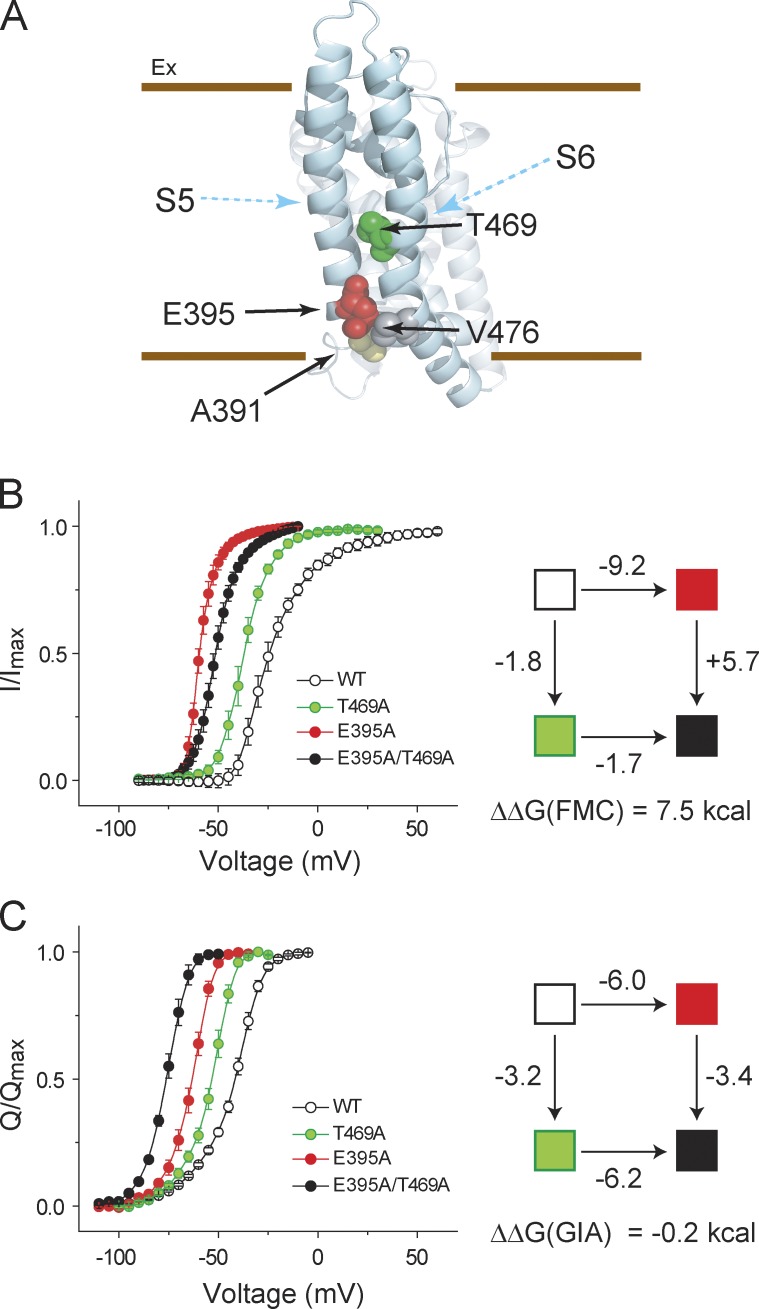
Figure 3.
Experimental comparison of interaction energies evaluated using FMC and GIA. (A) The structure of the pore domain of a single subunit of the KV1.2/2.1 paddle chimera showing the four residues (black arrows) that were examined. The S5 and S6 segments are marked for clarity (cyan arrows). (B, left) I/Imax curves for the WT channel and three mutants (E395A, T469A, and E395A-T469A). (right) FMC analysis for the E395 and T469 pair (ET), with each box colored as in the G-V curves on the left. The perturbation energy along each path was assessed from the I/Imax curves. (C, left) Normalized gating charge displacement versus voltage curves (Q-V) in WT channel and three mutants (E395A, T469A, and E395A-T469A). (right) GIA for the ET pair with each box colored as in the Q-V curves on the left. The perturbation energy along each path was assessed from the VM of the Q-V curves (assuming Qmax = 13.2 for all the mutations). Error bars represent SEM.

