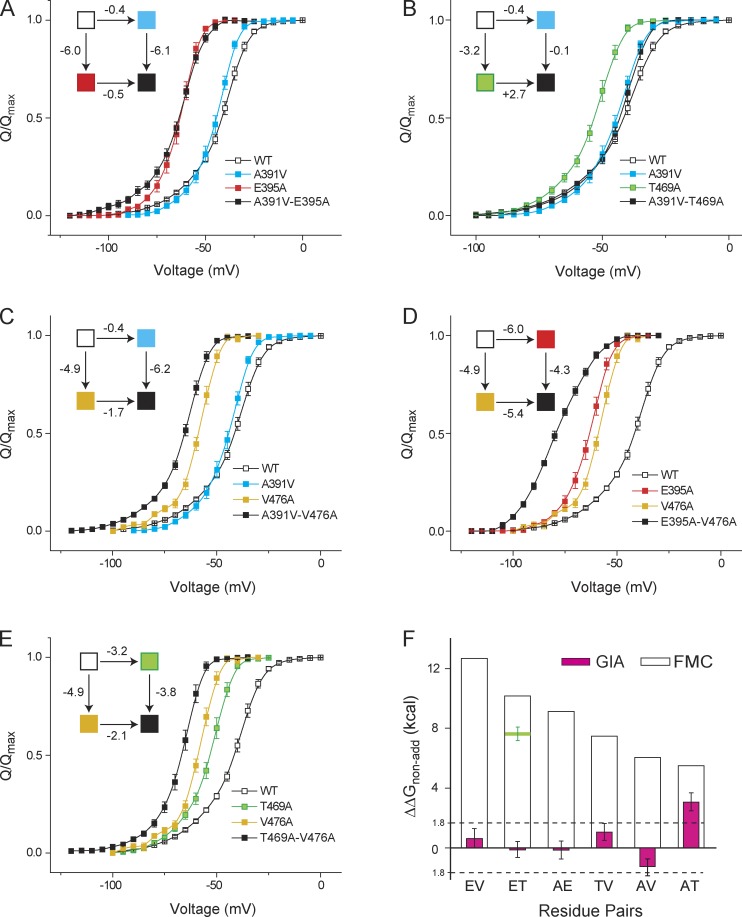
Figure 4.
Interaction energies evaluated using GIA differ from those evaluated using FMC. (A–E) GIA was used to measure the interaction energies between A391-E395 (AE; A), A391-T469 (AT; B), A391-V476 (AV; C), E395-V476 (EV; D), and T469-V476 (TV; E). In each case the normalized Q-V curves of the single and double mutants were measured, from which the VM was extracted and used to calculate the free energy of perturbation. The thermodynamic cycle for each pair is shown in the inset, in which each box corresponds to the WT or single or double mutants, colored as noted in the legends for each panel. (F) ΔΔGGIA for each pair was calculated using the Q-V curves and compared with ΔΔGFMC calculated using the Boltzmann fit parameters. For the ET pair, the horizontal green bar depicts ΔΔGFMC evaluated under our experimental conditions. Error bars represent SEM.

