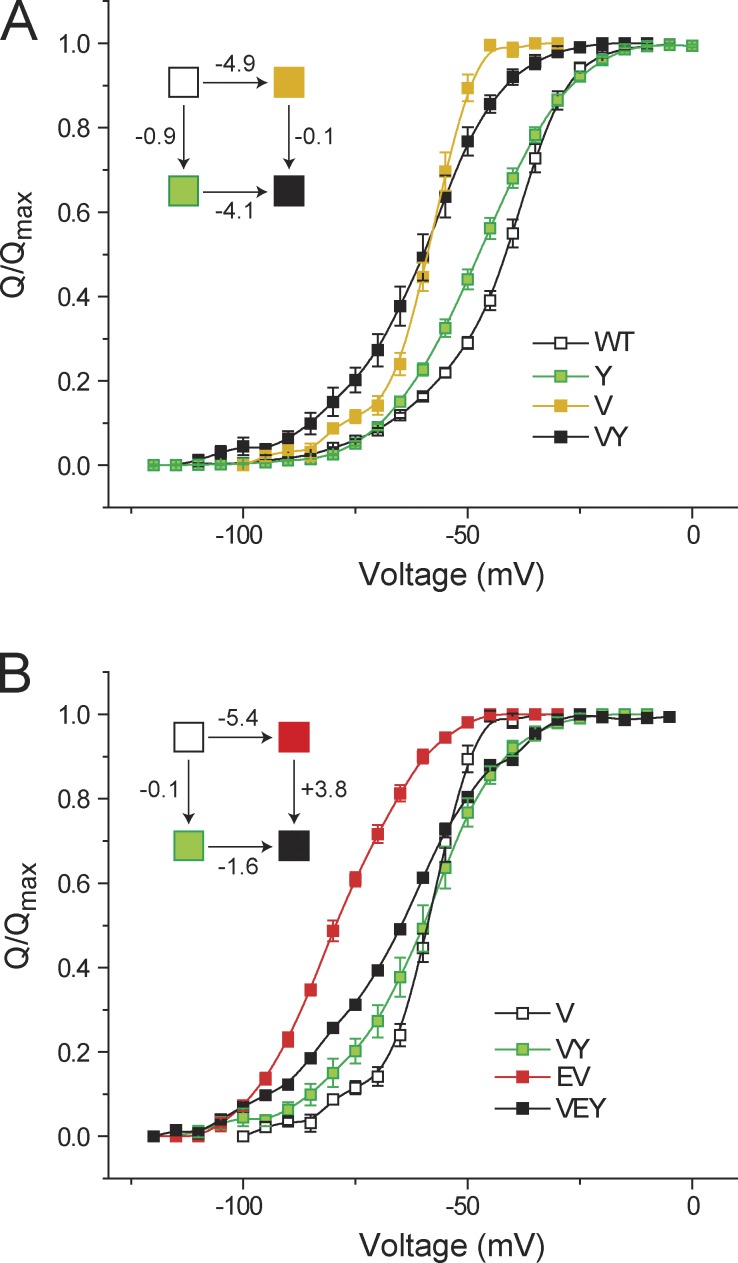
Figure 4.
Effect of V476 on the interaction between E395 and Y485. (A) Normalized Q-V curves to evaluate the interaction energy between V476 and Y485 using GIA, with the corresponding thermodynamic cycle in the inset. (B) Interaction energy between E395 and Y485 was assessed in the presence of the V476A mutation. The normalized Q-V curves for the single (E or Y) and double (EY) mutants, all in the background of the V476A mutation, are shown, along with the corresponding thermodynamic cycle. Error bars represent SEM.

